3.1 Wealth-income ratios across the world
- Analyzing the composition of an economy’s national wealth, between assets that are privately and publicly owned, is a prelude to understanding the dynamics of wealth inequality among individuals. New data have allowed us to better comprehend the evolution of countries’ wealth-income ratios and can help answer crucial policy questions.
- A general rise in the ratio between net private wealth and national income has been observed in nearly all countries in recent decades. It is striking to see that this long-run finding has largely been unaffected by the 2008 financial crisis, or by asset price bubbles in countries such as Japan and Spain.
- There have been unusually large increases in the ratios for China and Russia, which have quadrupled and tripled, respectively, following their transition from a communist- to a capitalist-oriented economy. Private wealth-income ratios in these countries are approaching levels observed in France, the UK, and the United States.
- Public wealth has declined in most countries since the 1980s. Net public wealth (public assets minus public debts) has even become negative in recent years in the United States and the UK, and is only slightly positive in Japan, Germany, and France. This arguably limits government ability to regulate the economy, redistribute income and mitigate rising inequality.
- In China, public property largely declined but remains at a high level today: net public wealth has stabilized at about 30% of national wealth since 2008 (as compared to 15%–25% in the West during the mixed-economy 1950–1980 period).
- The only exceptions to the general decline in public property seen in the data are oil-rich countries with large public sovereign funds, such as Norway.
- The structural rise of private wealth-income ratios in recent decades is due to a combination of factors including high saving rates and growth slowdowns (volume factors), the increase of real estate and stock prices (relative asset price factors), and the transfer of public wealth to private wealth (institutional factors), described in the next chapters.
New data have allowed us to better understand the relationship between wealth and inequality
Understanding how the level and structure of national wealth have evolved in the long run is one of the most fundamental economic questions. National income is a “flow” concept: it is defined as the sum of all income flows produced and distributed in a given country during a given year; it can also be broken down between the remuneration of labor and capital. National wealth, on the other hand, is a “stock” concept: it is defined as the sum of all assets—in particular housing, business, and financial assets, net of debt—that were accumulated in the past. The relationship between national wealth and national income can inform us about a number of key economic, social, and political evolutions, including the relative importance of capital in an economy and the structure of ownership.
Before we look at distribution of private wealth (that is, what share of private wealth is owned by the bottom 50% of the population, the top 10%, and so on), it is critical to better understand the evolution of total private wealth, and how it compares to public wealth and to total national wealth—which by definition is equal to the sum of private and public wealth. It is also important to keep in mind that the very notions of private property and public property can have very different meanings depending on the country or the period considered. For instance, private property in land or housing can take very different forms, depending on the extent of tenant rights, the length of their tenures, the ability of landlords to change their rents or expel them unilaterally, and so forth. In a similar way, corporate property may not have the same meaning when workers’ representatives hold substantial voting rights in corporate boards (such as in Nordic countries or Germany) as in countries where shareholders control all voting rights.
Also, public property in China today is a different reality from public property in this country forty years earlier, or in the context of Norway’s public sovereign fund today, and so on. Understanding the details of the legal, political, and governance system is important to understanding the interplay between property structure and power relations between social groups. The study of private and public wealth cannot be limited to the analysis of trends and levels; it must be grounded in a deeper understanding of the countries’ institutions and how these affect political and social inequality, as well.
Studying the evolution of national wealth-national income ratios can also help improve our knowledge on the structure of wealth, savings, and investment and thus can be used to study fundamental macroeconomic questions. These questions include: What are the long-run dynamics and prospects regarding the evolution of public debt? And what are the patterns of net foreign asset positions? In order to properly analyze these issues, it is critical to look at the entire national balance sheet—that is, the overall structure of who owns what. Public debt or foreign assets are not owned by the planet Mars; by definition, they belong to private or public property owners. Monitoring the evolution of capital accumulation and the composition of private assets, for example, can also help identify potential signs of instability in an economy. Indeed, in the cases of Japan and Spain, wealth-income ratios reached historical highs in 1990 and 2008, respectively, as both countries experienced asset market bubbles.
Until recently it was difficult to fully get to grips with such dynamics because of a lack of data. Thomas Piketty and Gabriel Zucman have recently presented harmonized annual series of wealth-income ratios for the eight largest rich economies in the world from 1700 onwards.1 These series have also been discussed in Capital in the Twenty-First Century and in the ensuing debates on the return to a patrimonial society.2
Their work has been extended by other researchers. The WID.world database now contains data on more than twenty countries, which we discuss in this report. In particular, we currently have series on the structure of private and public wealth in a number of emerging and ex-communist economies, which are able to provide new insights on crucial public policy issues.
We should stress, however, that this is an area where we still need to make a lot of progress. In particular, we still know far too little about the structure of public, private, and foreign ownerships in many areas of the developing and emerging world, particularly in Africa, Latin America, and Asia.
Private wealth-income ratios have risen remarkably since the 1970s
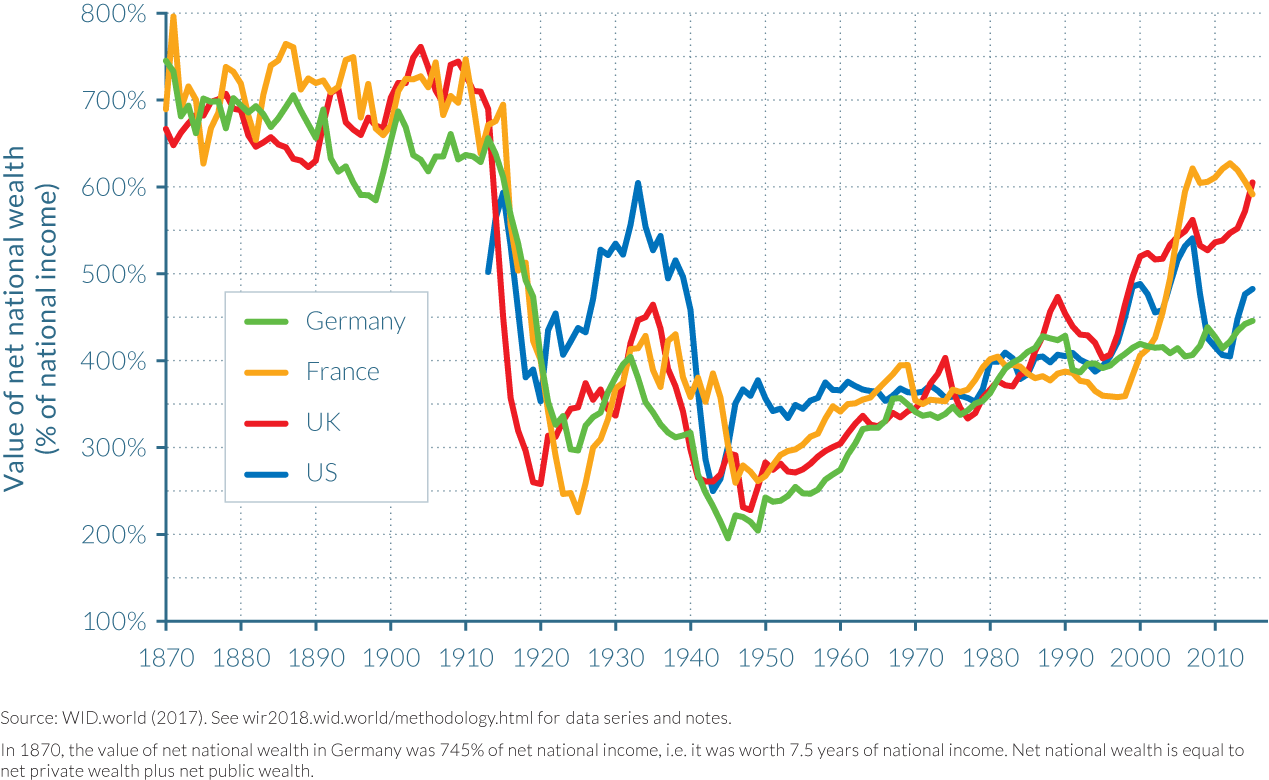
In 1970, private wealth-national income ratios ranged from around 200%–350% in most developed countries (see Figure 3.1.1 and Figure 3.1.2). The past four decades saw a sharp rise in these ratios in all countries. By 2007, the year in which the global financial crisis began, private wealth-national income ratios in the countries observed averaged 550%, peaking at 800% in the extreme case of Spain. Despite the fall in these ratios in some of the countries following the financial crisis and the decline in housing prices, the multi-decade trend seems to have been largely unaltered. By 2016, the market value aggregate private wealth—measured in years of national income—is typically twice as large in 2016 as in 1970.
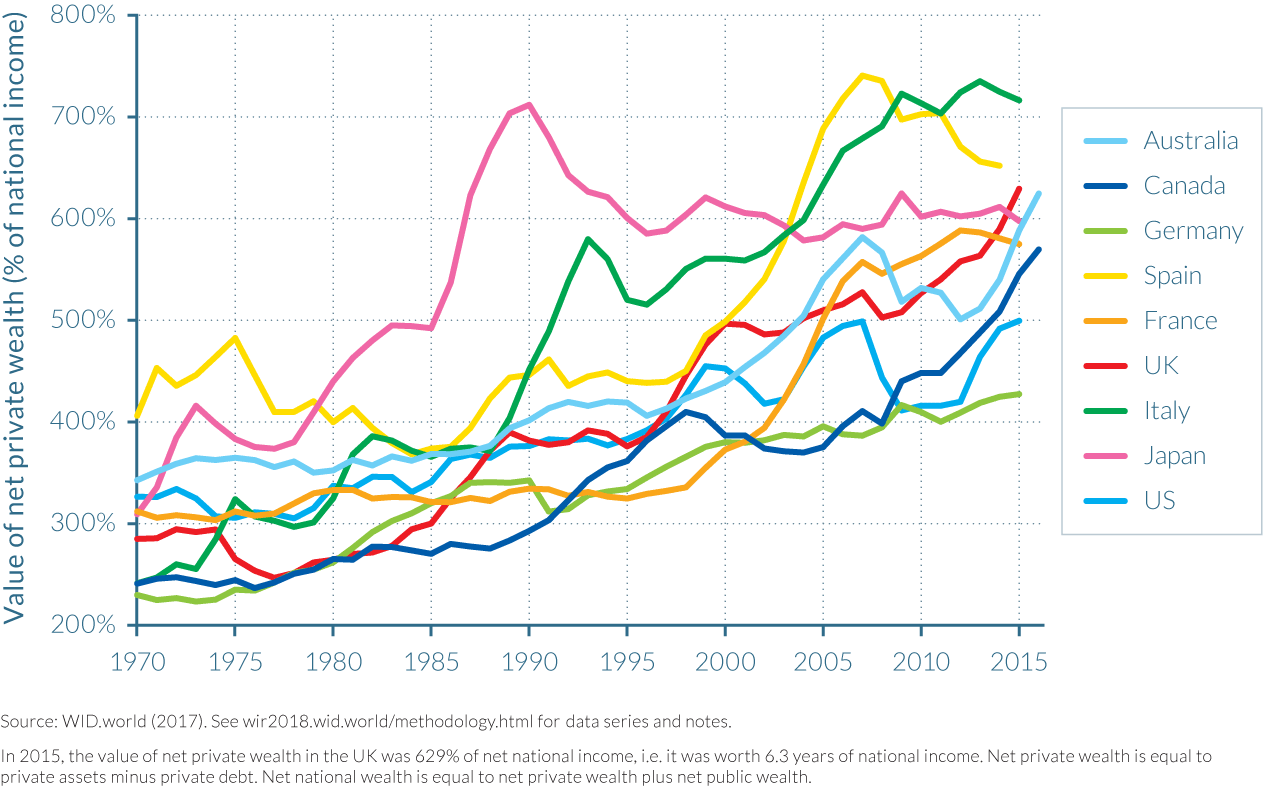
There have, however, been interesting cross-country variations in magnitudes and levels. Within Europe, country trajectories have been roughly similar as net private wealth rose from 250–400% of net national income in 1970 to 450–750% by 2016. Italy showed the most spectacular rise in its private wealth-to-income ratio, which approximately tripled from 250% in 1970 to over 700% in 2015, followed by the UK where the private wealth-national income ratio more than doubled, from approximately 300% to 650%, over the same forty-five years. France (from approximately 300% to more than 550%) followed a similar trajectory, though at a slightly lower order of magnitude, while this trend was also followed by Germany (from approximately 250% to 450%) and Spain (from about 400% to 650%) over the same period.
Outside of Europe, Australia and Canada demonstrated comparable evolutions in their private wealth-national income ratios to France, Italy, and the UK. Canada’s private wealth more than doubled between 1970 and 2016, from around 250% of net national income to more than 550%, while Australia’s rise was still significant but less striking, increasing from slightly less than 350% of national income to over 550%. In the United States, private wealth—relative to national income—rose by a half over the same time period, from less than 350% of national income to around 500%.
In Japan, the private wealth-income ratio also almost doubled over the time period (300% to almost 600%) and, like Spain, experienced enormous fluctuations as a result of its asset price bubble in the years leading up to 1990. In Japan, real estate and stock market prices rose dramatically from around 1986 as overly optimistic expectations regarding future economic fundamentals increased the value of the country’s capital assets and sent its private wealth-national income ratio soaring to as much as 700% by 1990. But soon after the Nikkei stock market index had plummeted and the price of assets followed suit, leading to what was dubbed the “lost decade” and a 150-percentage-point fall in the wealth-income ratio by 2000. However, despite further falls, the wealth-income ratio remained one of the highest among the rich countries. As explained in detail in chapter 4.6, Spain has followed a similar trend since the bursting of the country’s asset price bubble, with its wealth-to-income ratio falling by around 150 percentage points from its peak in 2007 to approximately 650% in 2014.
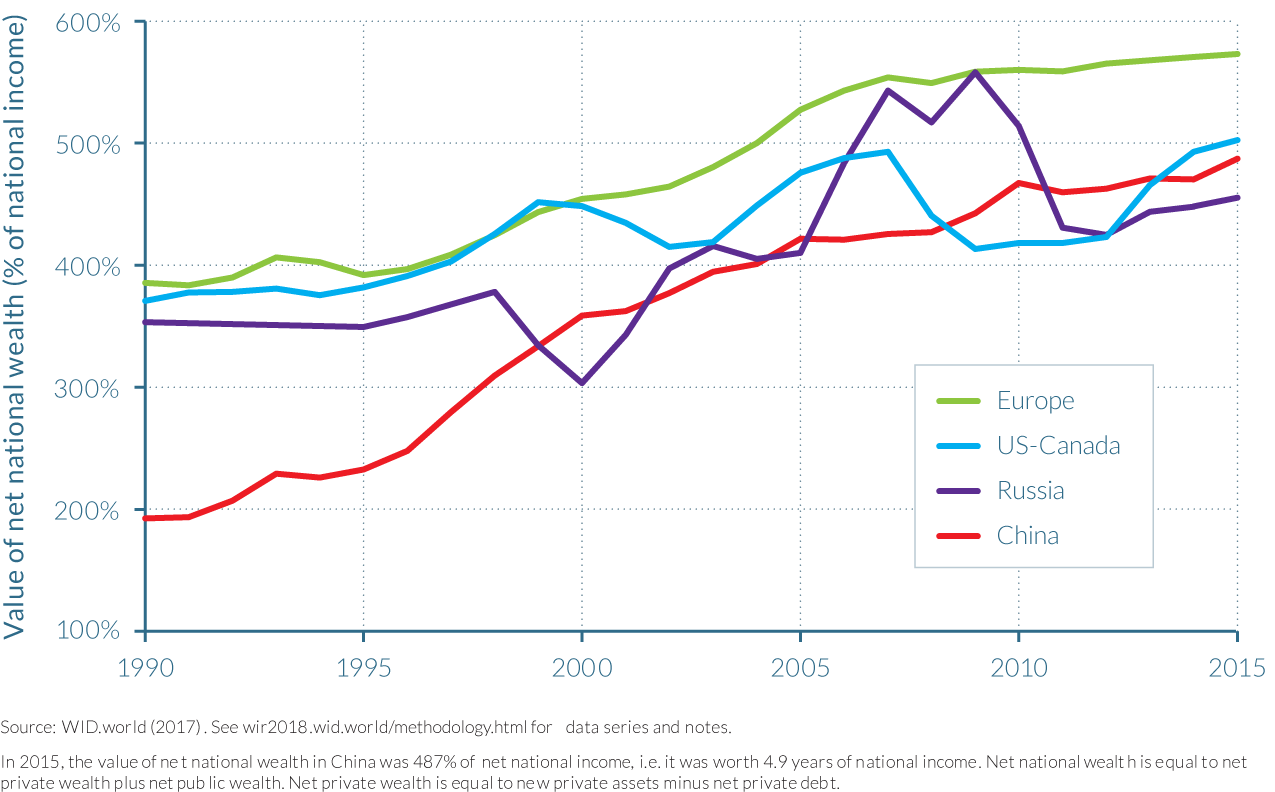
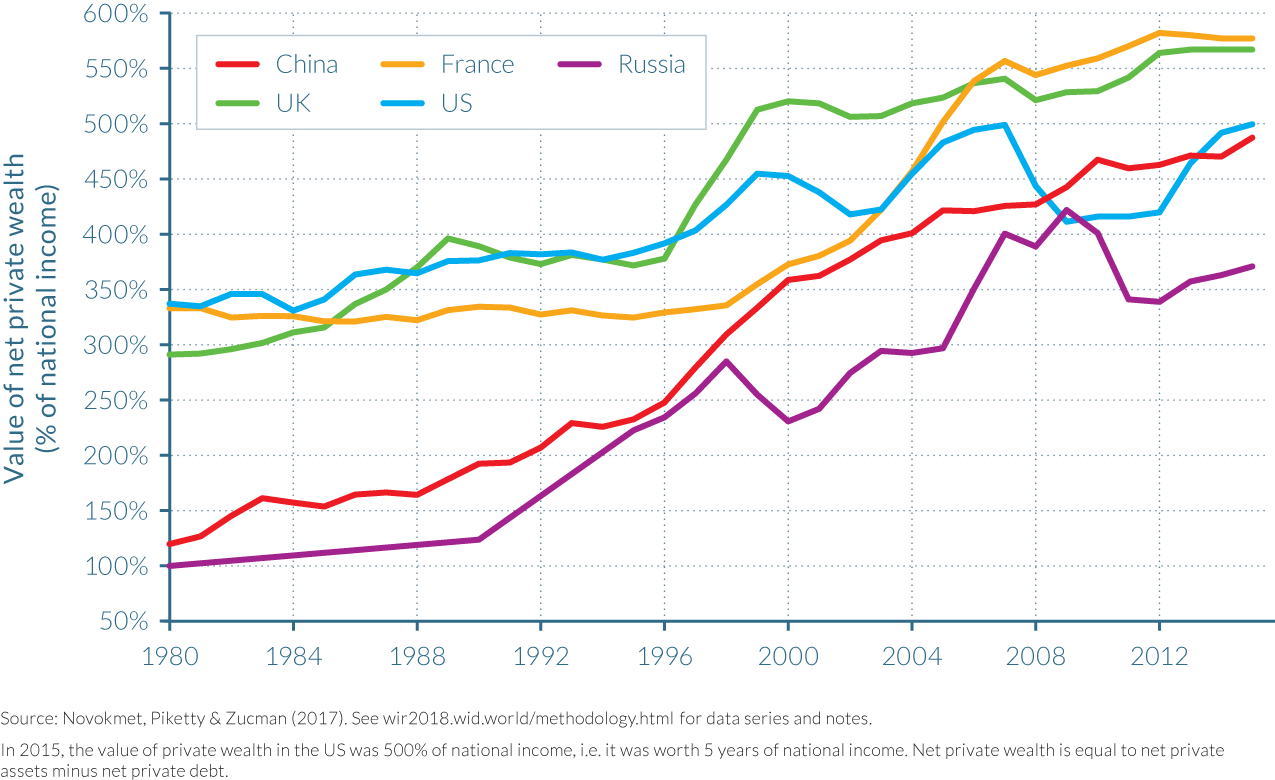
Thanks to recent research that has been completed on some of the world’s largest emerging economies, it is now also possible to compare how these countries’ wealth-income ratios have evolved. This is particularly interesting given the changes in political and economic regimes experienced in the emerging world over the period considered. As depicted in Figure 3.1.2, China and Russia both experienced large rises in their private wealth-income ratios after their transitions away from communism. While to some extent these increases are to be expected (as a large proportion of public wealth is transferred to the private sector), the scale of change experienced is particularly striking in China. The comparison with the trajectories observed in developed countries is also of particular interest (about which more will be said below).
At the time of the “opening-up” policy reforms in 1978, private wealth in China amounted to just over 110% of national income, but by 2015, this figure had reached 490%, following almost unrelenting rises. Russia’s transition began twelve years later in 1990, but the change since has been no less spectacular. Over this shorter period of time, Russia’s private wealth-income ratio more than tripled from around 120% to 370%. It is interesting to compare these changes with those in Europe and North America, described above, as China’s ratio is only just below that of the United States, and Russia is not a long way behind, either. Furthermore, the speed and scale of the change in these emerging economies far surpasses that seen in rich countries. By way of comparison, the only time the UK or the United States experienced a similar magnitude of change in wealth-income ratios followed their huge falls at the beginning of the twentieth century.
Rising national wealth-to-income ratios in recent decades come exclusively from the rise of private wealth
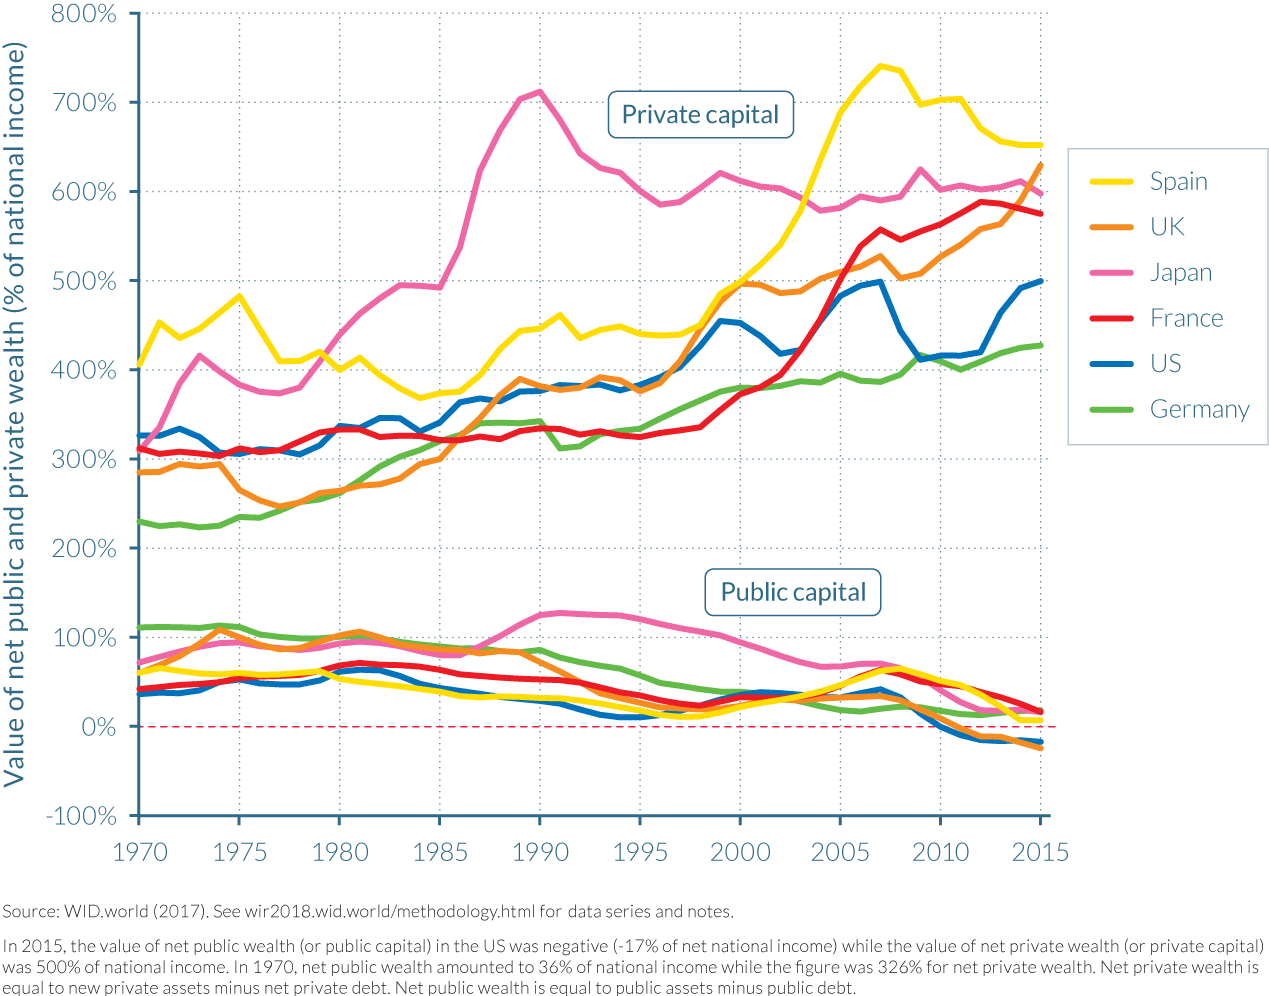
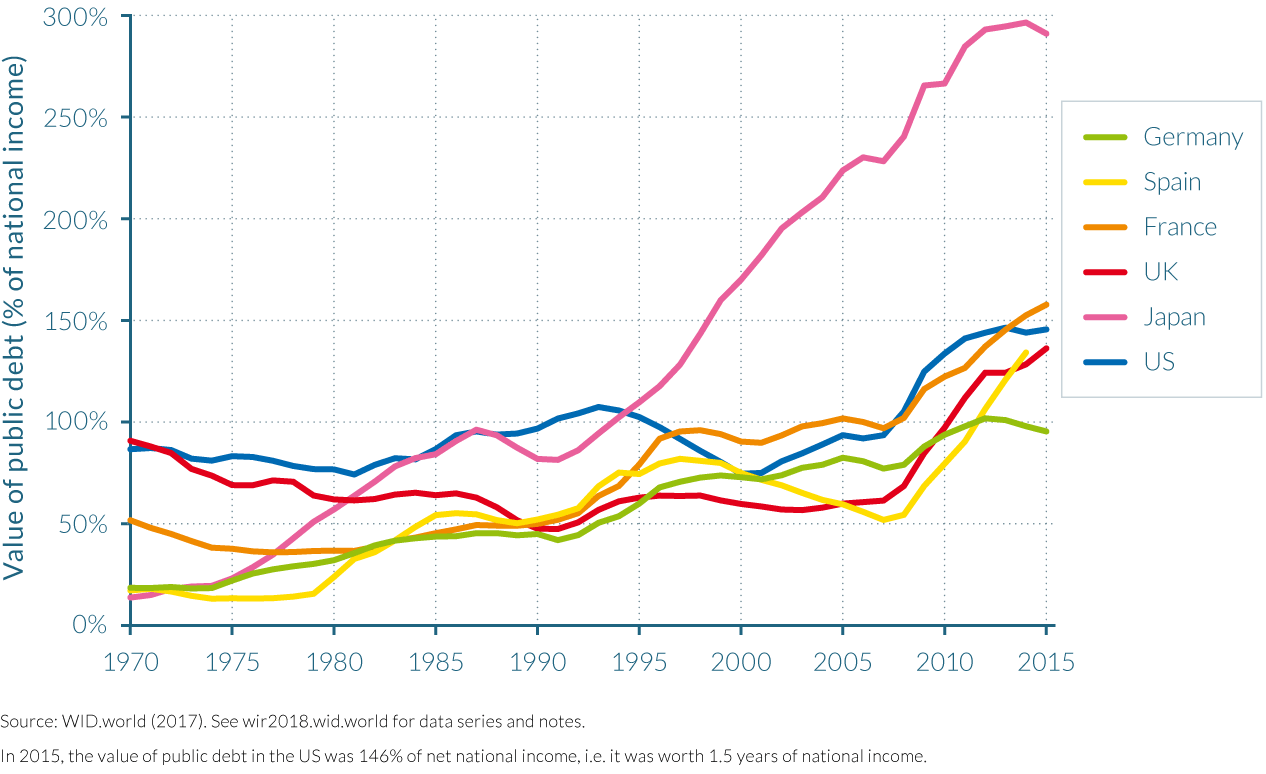
From Figure 3.1.3 it quickly becomes clear that the recent upward trend in national wealth-to-income ratios has exclusively been the result of private wealth accumulation. Indeed, in the UK and the United States, national wealth consists entirely of private wealth, as net public wealth has become negative (that is, public assets are now below public debt). France, Japan, and Germany have also experienced a significant decline in public wealth, which is now worth just about 10–20% of national income according to official estimates—that is, a very tiny fraction of total national wealth. The domination of private wealth in national wealth represents a marked change from the situation which prevailed in the 1970s, when net public wealth was typically between 50% and 100% of national income in most developed countries (and over 100% in Germany). Today, with either small or negative net public wealth, the governments of developed countries are arguably limited in their ability to intervene in the economy, redistribute income, and mitigate rising inequality. (More on this will be said below.)
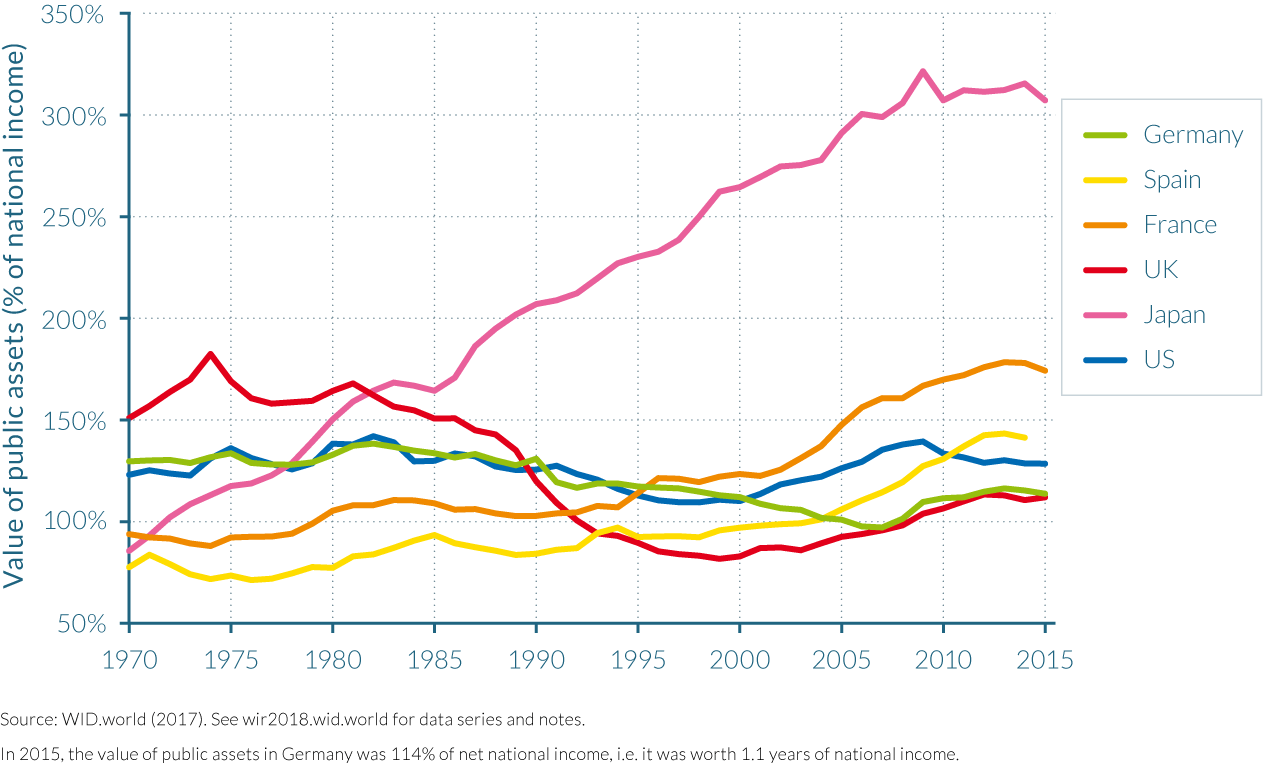
In practice, the decline in net public wealth in recent decades is mostly due to the rise of public debt, while the ratios of public assets to national income have remained relatively stable in most countries (see Figures 3.1.4a and 3.1.4b). The relative stability of public assets—relative to national income—can be viewed as the consequence of two conflicting effects: on the one hand, a significant fraction of public assets were privatized (particularly shares in public or semi-public companies, which used to be relatively important in a number of developed countries between the 1950s and the 1970s); on the other hand, the market value of the remaining public assets—typically public buildings hosting administrations, schools, universities, hospitals, and other public services—has increased over this time period.
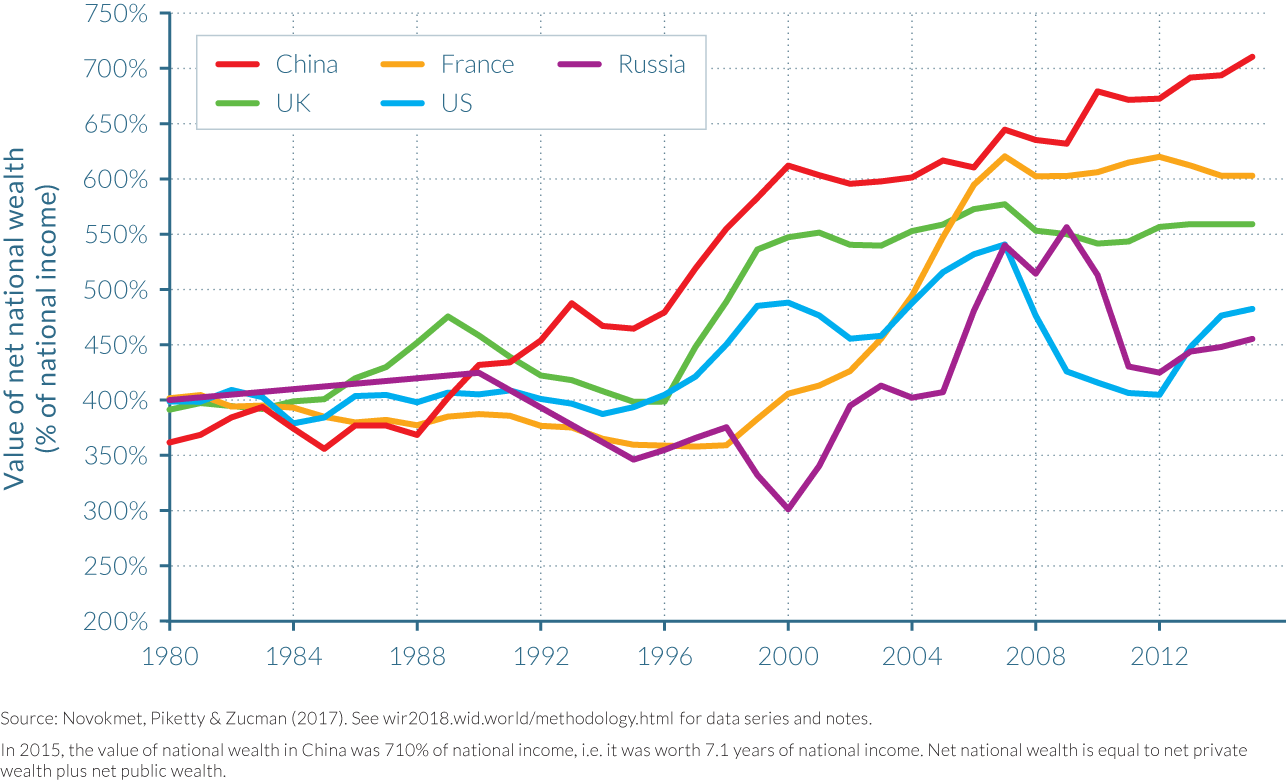
China and Russia provide two contrasting examples of how private-wealth-to-national-income ratios have evolved, relative to the aforementioned countries, for which the privatization strategies chosen by the two countries play an integral role. (This is further analyzed in chapters 3.2 through 3.4.) The gradual process of privatization of public wealth in China led to a slight over-fall in the value of public wealth as a proportion of national income, from just over 250% of national income in 1978 to approximately 230% in 2015, in a context of rapidly rising asset prices. In Russia, the voucher privatization strategy chosen aimed to transfer public assets into the private sector as quickly as possible, and subsequently had the effect of reducing the net public wealth to national income ratio enormously, from over 230% of national income in 1990 to around 90% in 2015.
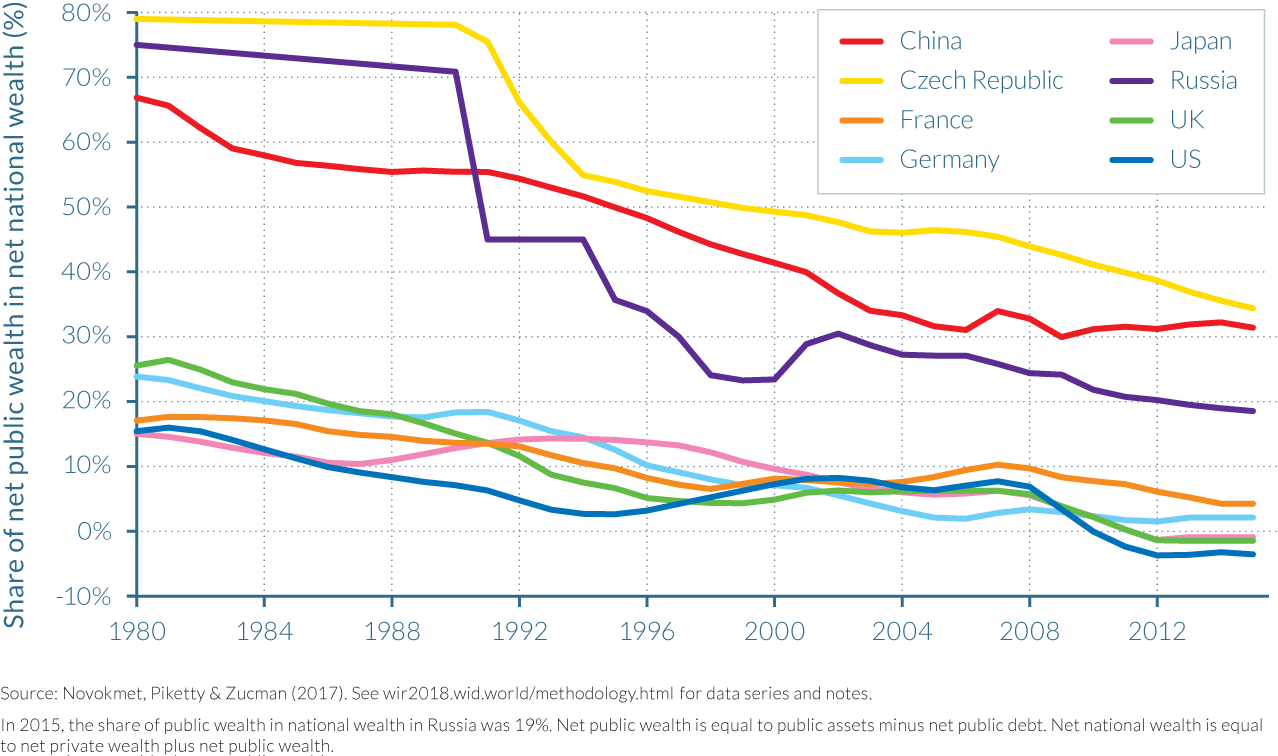
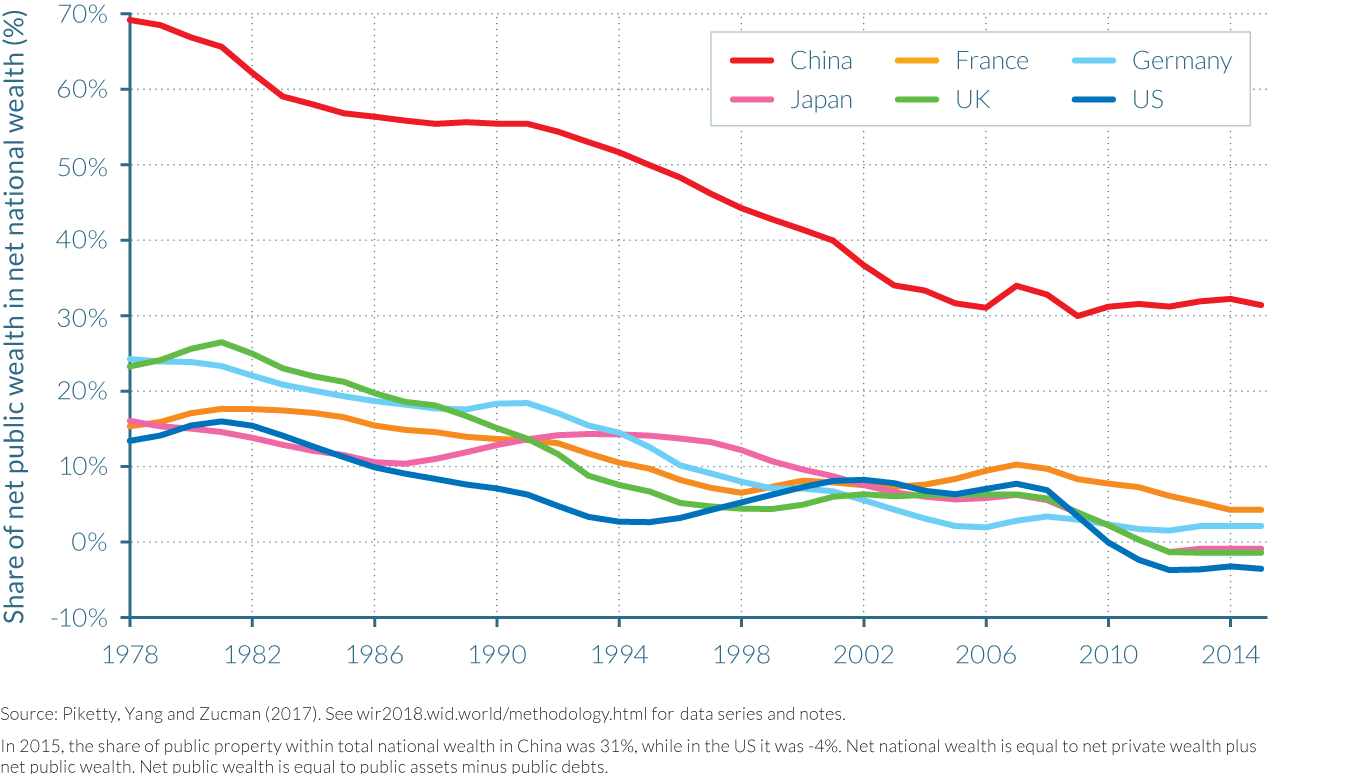
The dominance of private wealth over public wealth within countries is further highlighted by their relative shares in national wealth. As depicted by Figure 3.1.5, all observed countries (with the exception of Norway) have seen a decline in the value of public property relative to private property. In the late 1970s, the share of net public wealth in net national wealth was positive and substantial in all developed countries: it was as large as 25% in countries including Germany and Britain, and 15% in Japan, France, and the United States. By 2016, the share of public wealth has become negative in Britain and the United States, and is only marginally positive in Japan, Germany and France. In China, the share of public wealth was as large as 70% in 1978, and seems to have stabilized around 30% since 2008—a level that is somewhat larger (but not incomparable) to that observed in Western countries during the mixed-economy period of the 1950s–1970s.
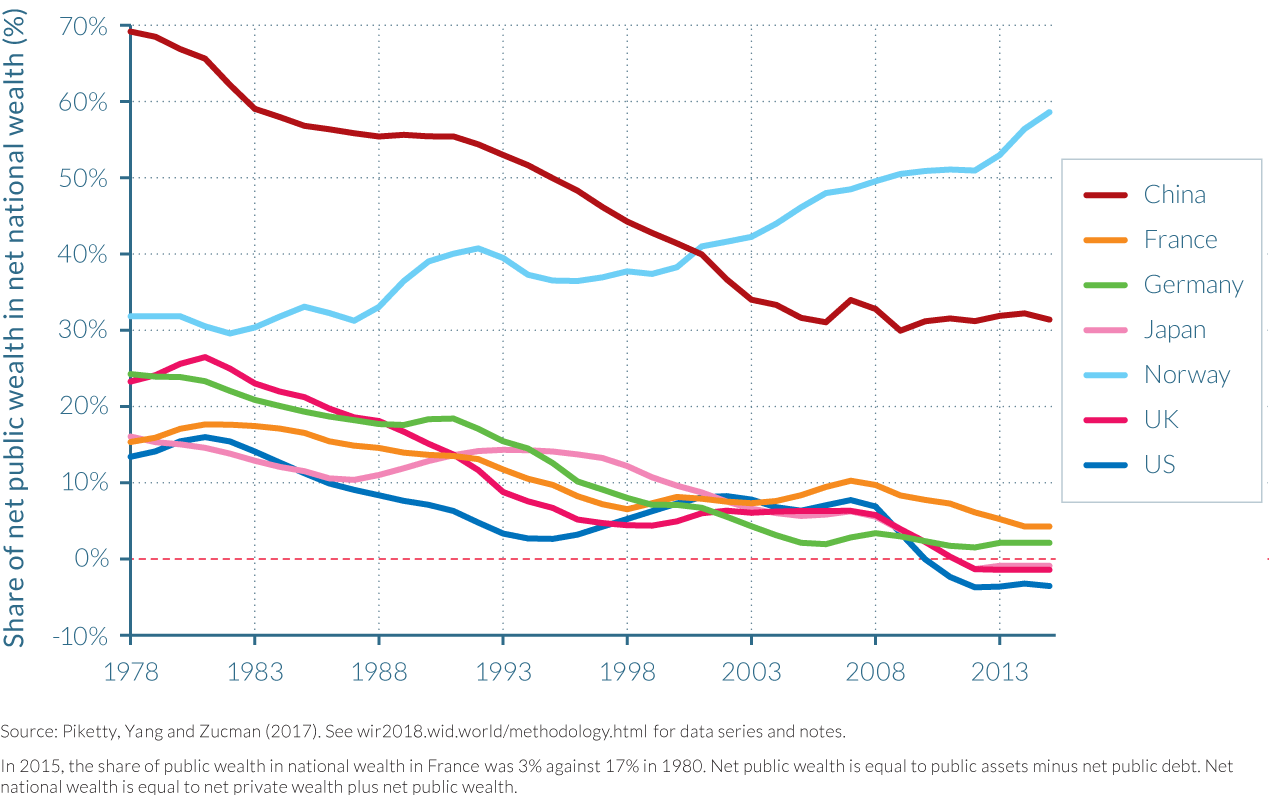
Norway, along with some other resource-rich countries, is unique in this sense, using its large sovereign investment fund to invest in projects that can increase the wealth of the state. Following oil and gas discoveries in 1969, the Norwegian government established a Global Pension Fund in the 1990s to invest a proportion of the revenue earned from these nonrenewable energy sources and ensure that the benefits from North Sea oil production accrued not just to the current generation, but also to future generations. This is seen as an important instrument of economic policy in Norway to support government saving, finance public expenditure, and wealth accumulation. As a result, the share of public wealth within total national wealth rose from around 30% in 1978 to almost 60% by 2015 as the value of public wealth rose to roughly 300% of national income (considerably greater than in China’s in relative terms).
There are two interesting comparisons to be made here that illustrate the importance of political institutions and ideologies in determining national wealth-to-income ratios. To summarize, it’s not only a question of oil—it depends on what the government decides to do with public wealth and with the economy. The first comparison is with Russia. Despite accumulating similar trade surpluses in relative terms to Norway—equal to around 200% of national income—according to official statistics, Russia has been unable to accumulate large foreign assets, and instead a significant proportion of these surpluses are estimated to be held in offshore assets and thus cannot be taxed or used for government expenditure (unlike in Norway). The second comparison is with the UK, given that it also was able to benefit from North Sea oil. In his book Inequality, What Can Be Done?, Anthony Atkinson poses a thoughtful question.3 “It is an interesting piece of conjectural history,” he writes, “to ask what would have happened if the UK had created such a fund in 1968 and had spent only the real return” in a similar way to Norway.4 Atkinson goes on to show that the accumulated fund for the UK would have been very considerable (some £350 billion), or about 60% of the Norwegian fund. As the UK is a larger country, the fund would have represented a smaller percentage of national income, but nevertheless, the fiscal cushion would have enabled the UK’s net worth to be positive in rather than negative today.
Recent evolutions in wealth-income ratios are likely the result of economic policy decisions and country-specific contexts
The following chapters provide a more detailed analysis of why wealth-income ratios developed as described above in developed countries since the 1970s (chapter 3.2), and in China and Russia since their respective transitions away from communist-dominated economic and political models (chapter 3.3).
In summary, the structural rise of private wealth-income ratios in recent decades has been due to a combination of factors. High saving rates and growth slowdowns (volume factors) were responsible for approximately 60% of the increase in national wealth-income ratios in the rich countries observed, while rises in real estate and stock prices (relative asset price factors) represented the remaining 40%. The transfer of public wealth to private wealth (institutional factors) is critical to understanding the evolution of private wealth-income ratios in China and Russia, but also in developed countries that underwent large privatization exercises (generally in the mid-1980s), though on a much smaller scale.
Since the financial crisis, trends in wealth-income ratios have varied between countries, underlining the importance of institutional and country-specific contexts. Wealth-income ratios dipped in all of the observed countries following the crisis, suggesting short-term capital losses were experienced as a result of falling asset prices, as evidenced by lower house prices and stock market indices across countries from 2008. The size, speed, and timing of the fall and subsequent recovery in ratios—which occurred to some extent in all but two countries for which data are available (Japan and Spain)—vary significantly, again highlighting how individual country circumstances can substantially affect the wealth-income ratio. For example, the fall in ratios in Spain (down 150%), and the United States (down 140%) are likely to have been larger than in other countries due to overinflated prices for stocks and property assets that helped to create the emergence of these bubbles in the first place (see chapter 4.5 in particular).
3.2 The evolution of aggregate wealth-income ratios in developed countries
- National savings and economic growth and asset prices are key to understanding how national wealth has evolved in the long run. National savings and growth account for about 60% of the rise in national wealth in rich countries, while asset prices account for the remaining 40%.
- The rise in housing largely drove domestic capital accumulation since the late 1970s, with significant variations across countries.
- External wealth has played an important role in the general evolution of wealth-income ratios.
- Today’s private wealth-national income ratios in rich countries appear to be returning to the high values observed in the late 19th century, which were as high as 600%–700%
National savings, economic growth, and asset prices are key to understanding how national wealth-income ratios have evolved in the long run
In order to properly analyze the evolution of national wealth-national income ratios and the structure of property, we need to combine a large number of complex explanatory factors and processes.
First, for a given level of national wealth, the division between private and public wealth is largely a consequence of government policies. If the government in Russia or China decides to privatize public assets—typically below market prices—then the share of private wealth will mechanically increase. More generally, if a government decides to run fiscal surpluses in order to accumulate public assets (and/or nationalize private assets, sometimes below or sometimes above market prices, depending on the historical and ideological context), then other things being equal, the share of public wealth will rise. If a government runs fiscal deficits and finances its deficits by issuing public debt or privatizing public assets, then the share of public wealth will decline.
In the case of developed countries, the combination of public policies (fiscal deficits, privatization of public assets, and expansion of public debt) followed since the 1970s led to a reduction of the share of public wealth from around 20% of national wealth in the 1970s (between 15% and 25%, depending on the specific country) to about 0% (or slightly negative levels) by 2016 (see Figure 3.1.5). If different fiscal and regulation policies had been followed, and if the public share in national wealth had remained at the same level as in the 1970s, then by definition the level of private wealth would be about 20% lower in 2016 than what it actually was (other things equal, that is, for a given level of national wealth). In that sense, the decline in public wealth explains a very large fraction of the overall rise in private wealth–national income ratios.
The other issue is to understand the evolution of national wealth–national income ratios. Here one needs to consider the interplay between the level of national savings (the sum of public and private saving), the level of economic growth (itself determined by population and productivity growth), and the evolution of relative asset prices. More precisely, following the work by Piketty and Zucman (2014), one can decompose the evolution of national wealth-national income ratios into two components: volume effects and price effects.
Volume effects are largely determined by the evolution of national savings: the higher the level of national savings, the larger the accumulation of national assets and hence national wealth. They also depend on the level of growth: for given savings, a lower population and/or productivity growth will tend to raise the ratio of national wealth to national income (simply because national income is lower). In sum, countries with high savings and low growth (for example, because of demographic stagnation, as in Japan and large parts of Europe) naturally tend to accumulate high national wealth–national income ratios.5
Price effects are determined by the evolution of asset prices—in particular, housing and equity prices—relative to consumer prices. This in turn depends on a number of institutional and policy factors—for example, the gradual lift of rent control contributed to the large increase in housing prices over the period—as well as on the patterns of saving and investment strategies. For example, if the aging households in Japan or Europe choose to invest a large proportion of their savings in domestic assets including real estate (and do not, or cannot, diversify their portfolio internationally as much as would have been possible) then it is perhaps not too surprising that high upward pressure is generated on housing prices.
By combining systematic data series on the patterns of saving, investment, and economic growth in developed countries since 1970, one can show that both volume and price effects have played a significant role. For example, looking at the eight largest developed economies, one finds that about 60% of national wealth accumulation between 1970 and 2010 can be attributed on average to volume effects, versus about 40% to price effects. It is worth noting, however, that there are very large cross-country variations. For instance, volume effects explain 72% of the accumulation of national wealth in the United States between 1970 and 2010, while residual capital gains explain 28%. Similar to the United States, new savings also appear to explain around 70–80% of national wealth accumulation in Japan, France, and Canada between 1970 and 2010, while residual capital gains accounted for the remaining 20–30%. Capital gains were larger, however, in Australia, Italy, and the UK, where they accounted for more than 40%–60% of the increase in wealth. In the UK, more than half of the country’s growth in wealth (58%) over the period was attributable to improvements in asset prices. On the contrary, asset prices were reduced over the period in Germany so savings accounted for all the rise in in national wealth—while capital gains actually moderated this rise.6
Our new extended series confirm these general findings. In particular, following the 2008 financial crisis, we observe very different patterns of asset price adjustments. For example, housing prices fell substantially in the United States and Spain (more on this below), and much more moderately in the UK and France. The general conclusion, however, is that the decline in asset prices observed in some countries in recent years is relatively small as compared to the long-run rise in relative asset prices observed since 1970.
What explains these important long-run capital gains in most countries identified in the data? To some extent, the capital gains made in the housing and stock markets since the 1970s–1980s can be understood as the outcome of a long-run asset price recovery. Asset prices fell substantially during the 1910–1950 period mainly due to low savings rates and negative valuation effects (including losses on foreign portfolios) and have been rising regularly ever since 1950. There might, however, have been some overshooting in the recovery process, particularly in housing prices. This could be explained by the kind of home portfolio bias described above.
Germany was the one interesting exception to the general pattern of positive capital gains. Given the country’s relatively large saving flows, one would expect to observe a higher national wealth-income ratio than the 430% recorded in 2015. According to estimates that include research and development expenditure in saving flows, “missing wealth” in Germany is of the order of 50%–100% of national income, suggesting that German statisticians may have either overestimated saving and investment flows, or underestimated the current stock of private wealth, or both. However, another possibility is that Germany had not experienced a long-run asset price recovery of the same magnitude as other countries because of the importance the German legal system places on the rights to control private assets by stakeholders other than private property owners. Rent controls, for example, may have prevented the market value of real estate from increasing as much as in other countries. Similarly, voting rights granted to employee representatives on corporate boards may reduce the market value of corporations. Germans may also not have the same preferences for expensive capital goods, especially housing, than the British, French, and Italians, perhaps the result of historical and cultural reasons that mean they favor living in a more polycentric country rather than one with a large centralized capital city.
Lastly, it is worth noting that when an average of wealth accumulation is computed for European countries as whole, capital gains and losses become less important as a factor in understanding gains in wealth-income ratios.7 Europe overall experienced lower residual capital gains than in France, Italy, and the UK due to the impact of Germany. Had regional balance sheets for the United States been available, it is possible that decomposing wealth accumulations would reveal that regional asset price variations within the United States would not be too different from those found in Europe. Therefore, it is possible that substantial relative asset price movements can become permanent within relatively small national or regional economic units, but these effects tend to correct themselves at a larger scale.8
The rise in housing wealth largely drove domestic capital accumulation
The accumulation of housing wealth has played a large role in the total accumulation of domestic capital, but with significant variations between countries. In France, Italy, and the UK, the rise in domestic capital-national income ratios is almost entirely due to the rise of housing (Table 3.2.1). In Japan, housing represents less than half of the total rise of domestic capital—and an even smaller proportion of the total rise of national wealth, given the large accumulation of net foreign assets.
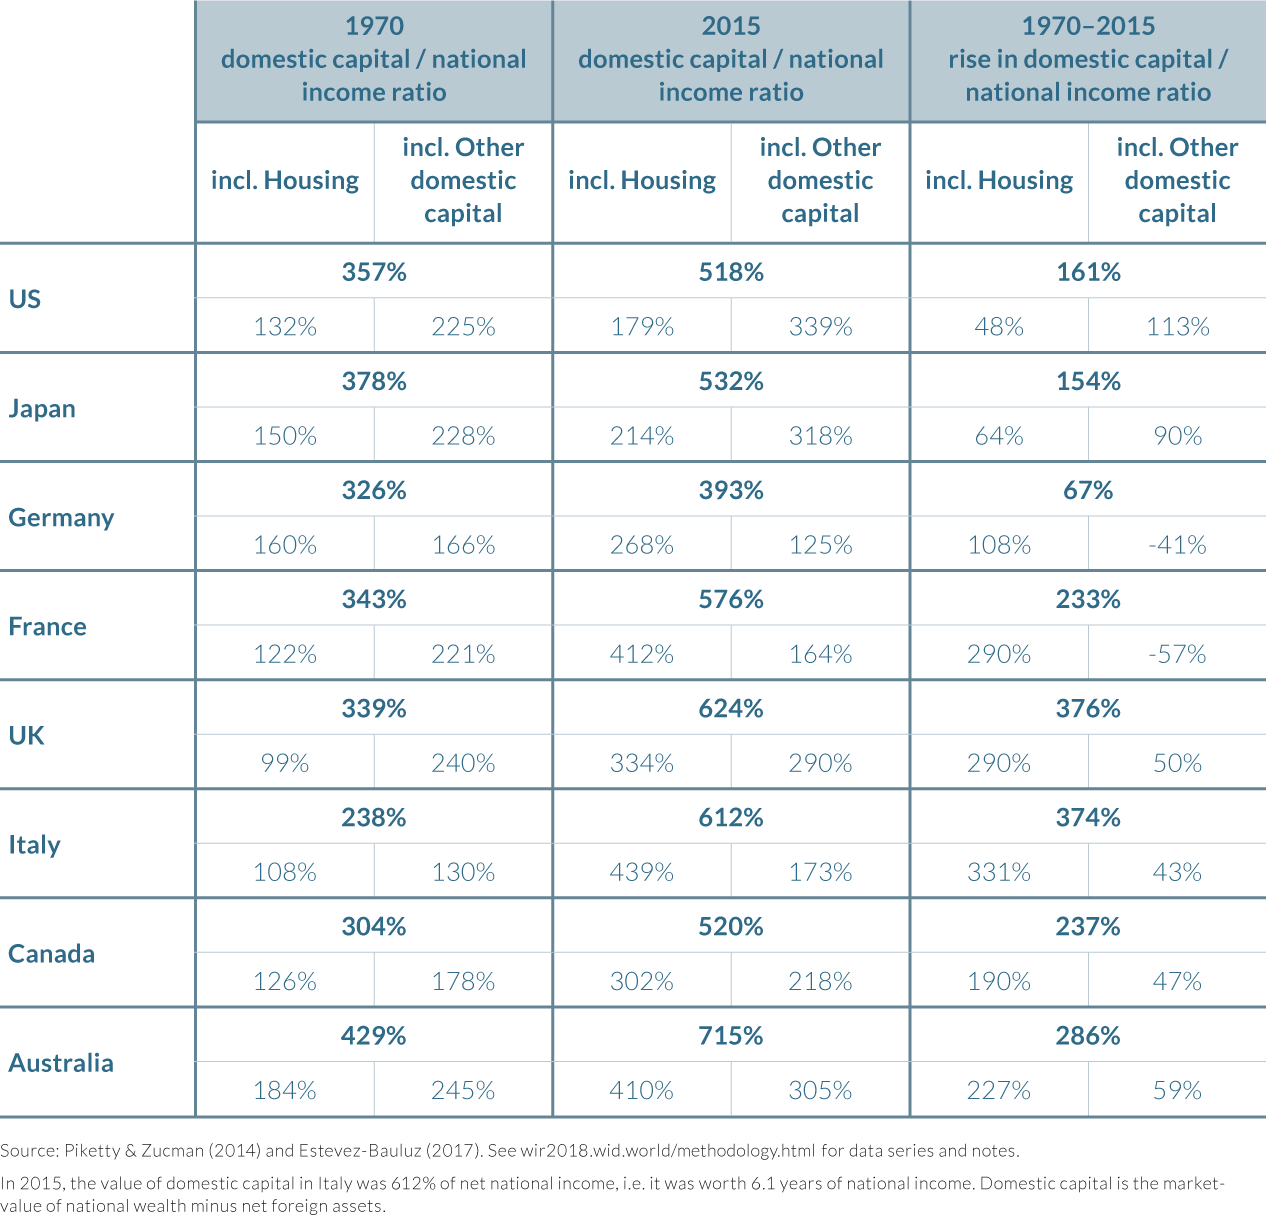
In most countries, other domestic capital goods have also contributed to the rise of national wealth, in particular because their market value has tended to increase. In particular, we can look at Tobin’s Q ratios—a definition of the gap between the market and the book value of corporations.9 These were much below 1 in the 1970s, meaning that the market value of wealth assets (that is, their price on the stock market) was considerably below their book value (that is, the value of assets based on the company’s balance sheet account; their assets minus liabilities) and were closer to 1 (and at times above 1) in the 1990s–2000s. But there are again interesting cross-country variations. Tobin’s Q was very low in Germany, remaining well below 1 (and typically around 0.5), contrary to values in the UK and the United States. One interpretation is the “stakeholder effect” described briefly above. Shareholders of German companies do not have full control of company assets—they share their voting rights with workers’ representatives and sometimes regional governments—which might push a company’s stock market value below its book value.10 However, another possibility is that some of the variations in Tobin’s Q reflect data limitations. Quite puzzlingly, indeed, in most countries Tobin’s Q appears to be structurally below 1, although intangible capital is imperfectly accounted for, which in principle should push values above 1. Part of the explanation may be that the book value of corporations tend to be overestimated in national accounts.
External wealth has played an important role in the general evolution of wealth-income ratios
The above analysis of how wealth has been accumulated in rich countries does not differentiate whether wealth was accumulated domestically or abroad. National wealth can be viewed as the sum of domestic wealth and net foreign wealth—that is, foreign assets (assets owned by domestic residents in other countries) minus its gross foreign liabilities (domestic assets owned by residents from other countries). Reviewing the data on national and net foreign wealth for the 1970–2016 period indicates that net foreign wealth—whether positive or negative—has been a relatively small part of national wealth in rich countries throughout the 1970–2016 period (see Figure 3.2.1).
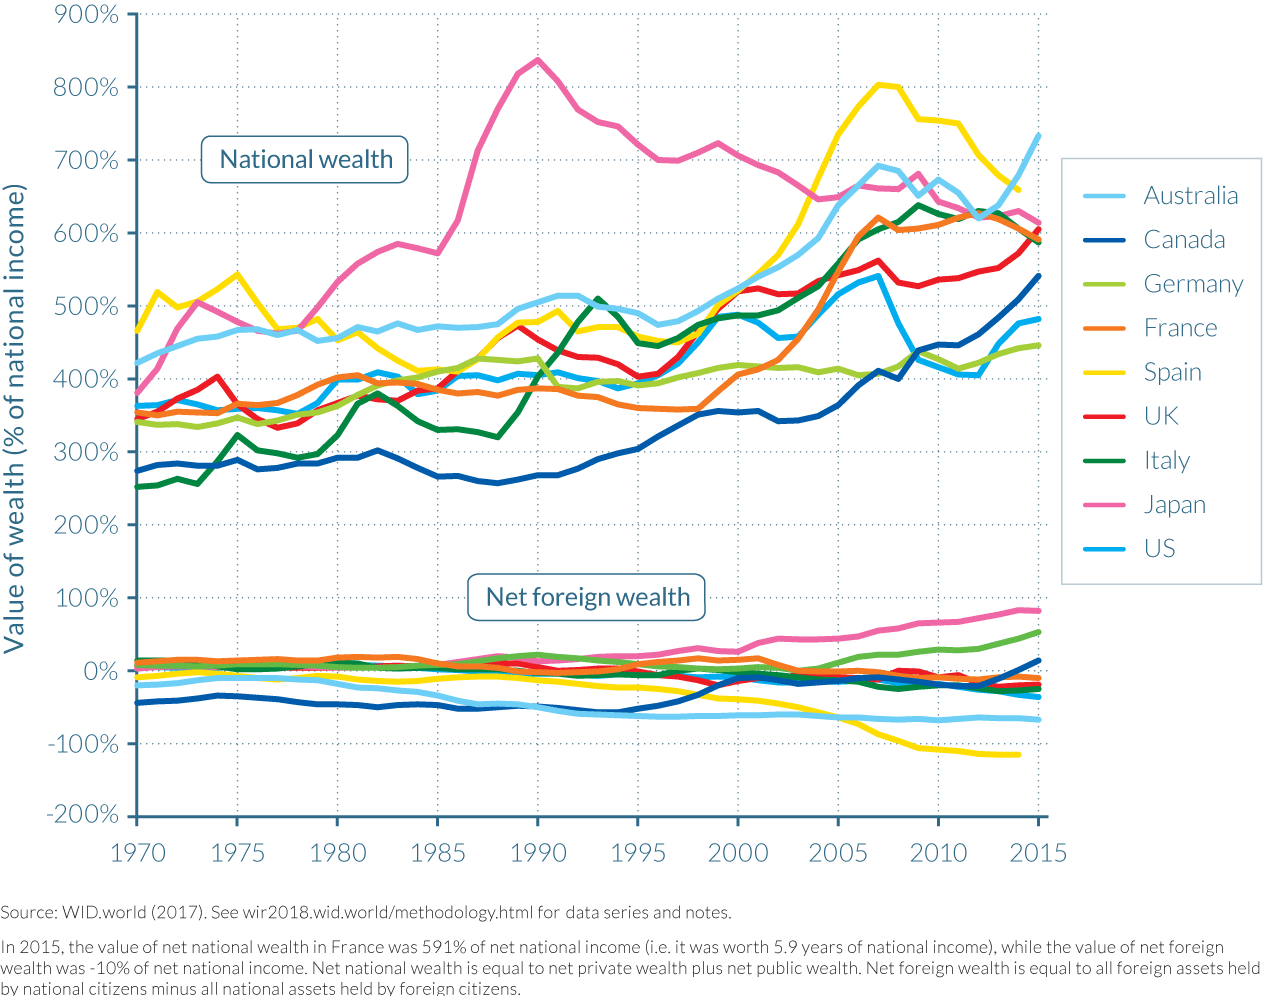
Despite net foreign assets representing a relatively small fraction of national wealth, external wealth has played an important role in the general evolution of wealth-income ratios. First, Japan and Germany accumulated sizable positive net foreign positions in the 1990s and 2000s, as these export-orientated economies generated large trade surpluses, and by 2015, the countries owned the equivalent of about 50% and 70% of national income in net foreign assets, respectively. Although Japan’s and Germany’s net foreign positions are still substantially smaller than the positions reached by France and the UK before the First World War, they have nonetheless grown to be substantial. As a result, the rise in net foreign assets represents more than a quarter of the total rise of the national wealth-national income ratios in the two countries. By contrast, most of the other rich nations exhibit net foreign positions which are negative—typically between -10% and -30% of national income—and which have generally declined over the period. One caveat to these official net foreign asset positions is that they do not include the sizable assets held by a number of developed country residents in tax havens. In all likelihood, including these assets would turn the rich world’s total net foreign asset position from negative to positive, and this improvement would probably be particularly large for Continental Europe where 15% of the region’s GDP is estimated to be held in offshore tax havens.11 Chapter 3.4 and chapter 4.5 also provide estimations of offshore wealth in Russia and Spain, respectively.
Second, there has been a huge rise in the total amount of foreign assets owned by countries since the 1970s, such that a significant share of each rich country’s domestic capital is now owned by other countries. The rise in cross-border positions is significant everywhere, being spectacularly large in Europe, and a bit less so in the larger economies of Japan and the United States. One implication is that capital gains and losses on foreign portfolios can be large and volatile over time and across countries, and indeed foreign portfolios have generated large capital gains in the United States (but also in Australia and the UK) and significant capital losses in some other countries (Japan, Germany, France). Strikingly, in Germany, virtually all capital losses at the national level can be attributed to foreign assets. In the United States, net capital gains on cross-border portfolios represent one-third of total capital gains at the national level, and the equivalent of the total rise in the US national wealth-national income ratio since 1970.
Returning to the gilded age?
It is almost impossible to properly understand the rise of wealth-income ratios in developed countries in recent decades without putting the recent period into a longer historical perspective. As outlined above, a significant part of the rise of wealth-income ratio since 1970 is due to capital gains: about 40% on average, with large differences between countries. But the key question is: Were these capital gains due to a structural, long-run rise in the relative price of assets (caused, for example, by uneven technical progress), or was this a recovery effect that could have compensated for capital losses observed during earlier parts of the twentieth century?
Analyzing the evolution of wealth-income ratios over a further one hundred years reveals that capital gains experienced since 1970 were due to recovery effects. Because of historical data limitations, this long-term analysis is restricted to four countries—namely, France, Germany, the UK, and the United States. However, these countries indicate two clear patterns. For the three European countries, similar U-shaped patterns are evident, such that today’s private wealth-national income ratios appear to be returning to the high values observed over the period 1870–1910, which were as high as 600%–700%.
In addition, European public wealth-national income ratios have followed an inverted U-curve over the past century. However, the magnitude of the pattern of public wealth accumulation is very limited compared to the U-shaped evolution of private wealth, meaning that European national wealth-income ratios are strongly U-shaped, too (see Figure 3.2.2). It can also be observed that at around the start of the twentieth century, European countries held a very large positive net foreign asset position, averaging around 100% of national income. Interestingly, the net foreign position of Europe has again turned (slightly) positive in 2000–2010, when the national wealth-income ratio again exceeded that of the United States.
Starting from this set of descriptive facts, and using the best historical estimates of saving and growth rates, it is also possible to estimate the relative contribution of savings and capital gains since 1870. This exercise shows that total accumulation of national wealth over this 140-year-long period appears to be well accounted for by saving flows. But in order to fully reconcile differences in private wealth-income ratios, small residual capital gains are required for France, the UK, and the United States, and a small residual capital loss for Germany. In all cases, however, saving flows account for the bulk of wealth accumulation: capital gains seem to wash out in the long run.
Dividing the analysis by sub-periods, it becomes clear that in every European country a strong U-shaped relative capital price effect was experienced. In the UK, for example, negative rates of real capital losses near -2% per year were experienced between 1910 and 1950, followed by real gains of approximately +1% per year between 1950 and 1980 and around 2.5% between 1980 and 2010.12 France also exhibits similar patterns, and collectively the data for these two countries seem to illustrate a slight overshooting in the recovery process so that the total relative asset price effect over the 1910–2010 period appears to be somewhat positive. In Germany, by contrast, the recovery seems like it is yet to emerge, as the total relative asset price effect averaged close to -1% between 1910 and 2010.
This sub-period analysis allows for the huge decline in wealth-income ratios that occurred in Europe between 1910 and 1950 to be decomposed.13 In the UK, war destructions played a negligible role, accounting for an estimated 4% of the total decline in the wealth-income ratio. Instead, low national savings during this period accounted for 46% of the fall in the wealth-income ratio and negative valuation effects (including losses on foreign portfolios) for the remaining 50%. These negative valuation effects were in part due to the numerous anti-capital policies were then put into place after the First World War—before which, capital markets largely ran unfettered. These policies were gradually lifted from the 1980s on, contributing to an asset price recovery.
In France and Germany, cumulated physical war destructions account for about one-quarter of the fall in wealth-income ratios. Low national saving and real capital losses each explain about half of the remaining three-quarters. Interestingly, the private wealth-national income ratio declined less in the UK than in France and Germany between 1910 and 1950, but the reverse holds for the national wealth-income ratio, due to the large quantity of public debt held by the UK around 1950. The US case is again fairly different from that of Europe, however, as the fall in the country’s wealth-income ratio during the 1910–1950 period was more modest, and so was the recovery since 1950. Regarding capital gains, every sub-period in the United States shows small but positive relative price effects. The capital gain effect grew larger in the recent decades and largely derived from United States’ growing foreign portfolio, as it seems too large to be accounted for by underestimated saving and investment flows.
These results show that over a few years and even a few decades, valuation effects and war destructions are of paramount importance in determining wealth-to-income ratios. But in the main rich economies, today’s wealth levels are reasonably well explained by saving and income growth rates across the period since 1870.
These findings have a number of implications for the future and for policy making. First, the low wealth-income ratios of the mid-twentieth century were due to very special circumstances. The world wars and anti-capital policies destroyed a large fraction of the world capital stock and reduced the market value of private wealth, which is unlikely to happen again with free markets. By contrast, the determinants of the wealth-income ratio—saving and growth rates—will in all likelihood matter a great deal in the foreseeable future. As long as countries keep saving sizable amounts (due to a mixture of bequest, lifecycle, and precautionary reasons), countries with low growth rates are bound to have high wealth-income ratios. For the time being, this effect is stronger in Europe and Japan, but to the extent that growth will ultimately slow everywhere, wealth-income ratios may well ultimately rise across the whole world.
The return of high wealth-income ratios is certainly not bad in itself, but it raises new issues about capital taxation and regulation. Because wealth is always very concentrated (due in particular to the cumulative and multiplicative processes governing wealth inequality dynamics—see Part IV for more detail on this), high wealth-income ratios imply that the inequality of wealth, and potentially the inequality of inherited wealth, is likely to play a bigger role for the overall structure of inequality in the twenty-first century than it did in the postwar period. This evolution might reinforce the need for progressive capital and inheritance taxation.14 If international tax competition prevents this policy change from happening, one cannot exclude the development of a new wave of anti-globalization and anti-capital policies.
Furthermore, because saving and growth rates are largely determined by different forces, wealth-income ratios can vary a great deal between countries. This fact has important implications for financial regulation. With perfect capital markets, large variations in wealth-income ratios potentially imply large net foreign asset positions, which can create political tensions between countries. With imperfect capital markets and home portfolios bias, structurally high wealth-income ratios can contribute to domestic asset price bubbles such as those seen in Japan and Spain. Housing and financial bubbles are potentially more devastating when the total stock of wealth amounts to six to eight years of national income rather than only two to three years. The fact that the Japanese and Spanish bubbles are easily identifiable in the dataset also suggests that monitoring wealth-income ratios may help designing appropriate financial and monetary policy. In Japan and Spain, most observers had noticed that asset price indexes were rising fast, but in the absence of well-defined reference points, it is always difficult for policy makers to determine when such evolutions have gone too far and whether they should act. Wealth-income ratios and wealth accumulation decompositions can provide useful, if imperfect, reference points here.
3.3 Comparing the experiences of former communist states
Information in this chapter is based on two sources. The first is “From Soviets to Oligarchs: Inequality and Property in Russia 1905–2016,” by Filip Novokmet, Thomas Piketty, and Gabriel Zucman, 2017. WID.world Working Paper Series (No. 2017/9). The second is “Capital Accumulation, Private Property and Rising Inequality in China, 1978–2015,” by Thomas Piketty, Li Yang, and Gabriel Zucman, 2017. WID.world Working Paper Series (No. 2017/6).
- The evolution of public and private wealth in China and Russia since their transitions away from communism can be viewed as extreme cases of the general rise of private wealth relative to national income in rich countries since the 1970s–1980s.
- Their experiences are largely explained by institutional differences, particularly their respective privatization strategies for public assets. Privatization occurred at a much faster rate, in a more chaotic manner and at a larger extent in Russia than in China due to its “shock therapy” liberalization policies and voucher privatization schemes for state owned enterprises.
- Despite being at roughly equal levels in 1980, private wealth reached approximately 500% of national income in China by 2015—roughly equal to levels seen in the US and just below those of France and the UK (550–600%), while this figure was notably smaller for Russia, on the order of 350–400%.
- Public wealth remained at around 200–250% in China between 1980 and 2015, but decreased tremendously from 300% to less than 100% in Russia, again reflecting differences in the countries’ privatization strategies.
- Differences in savings and investment incentives saw a significant proportion of Russian wealth leave the country to be held in offshore assets, while the overwhelming majority of Chinese wealth stayed within the country’s boundaries to be invested in domestic assets.
Privatization strategies were key in determining wealth accumulation differences between China and Russia
The transition away from communism in both China and Russia had profound effects on aggregate wealth in both countries. However, there were also considerable differences between the two countries, which are first evident in the evolution of their respective private wealth–national income ratios. As examined in detail in chapter 3.2, the general rise of private wealth relative to national income in rich countries since the 1970s–1980s can be attributed to a combination of factors including the combination of growth slowdowns and relatively high saving rates and general rises in asset prices. The case of Russia together with that of China and other ex-communist countries can be viewed as an extreme case of this general evolution, but the liberalization and public asset privatization strategies chosen by the two countries also had crucial impacts on the development of these countries’ wealth to national income ratios.
In Russia as in China, private wealth was very limited back in 1980, at slightly more than 100% of national income in both countries. But by 2015, private wealth reached approximately 500% of national income in China, roughly equal to levels seen in the US, and rapidly approaching the levels observed in countries such as France and the UK (550–600%). Private wealth in Russia has also increased enormously relative to national income, but the ratio was comparatively only of the order of 350–400% in 2015—that is, at a markedly lower level than in China and in Western countries as illustrated by Figure 3.3.1. This gap would have been larger if estimates of offshore wealth were not included in Russia’s private wealth (more to come on this in chapter 3.5). This is an important source of wealth to include in estimates for Russia as it represents approximately 70% of national income, while the global average offshore wealth is estimated to be in the region of 10% of national income.15
The rise of national wealth in Russia has been almost exclusively driven by increases in private wealth, which have themselves come at the expense of public wealth. National wealth increased only weakly relative to national income during the last quarter of a century, rising from 400% in 1990 to 450% by 2015, with public wealth falling from around 300% of national income to below 90%. In contrast, China’s public wealth remained relatively constant from 1978 to 2015, staying above 230% of national income. Given the large rise in private wealth described above, national wealth has thus doubled from around 350% to 700% of national income over the period (see Figure 3.3.2). Interestingly, national wealth fell notably following the end of communism in Russia, dropping from around 425% of national income in 1990 to 300% in 2000. This was largely due to the speed at which the so-called shock therapy and voucher privatization strategy was implemented to transfer public wealth to the private sector (particularly that of state-owned enterprises). However, while public wealth-income ratios in China fluctuated during the first decade that followed the “reform and opening up” policies of 1978, they have risen almost constantly since. The speed of privatization of both state-owned enterprises and housing stock was much slower in China than in Russia, allowing for a more gradual and consistent transfer of wealth from the public to the private sector. The larger variations seen in Russian wealth as compared to Chinese wealth that occurred between 1998 and 2002, and between 2006 and 2010, can in large part be explained by the stock market fluctuations experienced in Russia during these periods of time.
Understanding the differences in wealth accumulation between China and Russia
The widely divergent patterns of national wealth accumulation observed in Russia and China can be accounted for by a number of factors. First, saving rates (net of depreciation) have been markedly higher in China, typically as large as 30–35%, as compared to 15–20% at most in Russia. If a country saves more, it is natural that it will accumulate more wealth. Second, these Chinese savings were used for the most part to finance domestic investment and hence domestic capital accumulation in China. In contrast, a very large fraction—typically about half—of Russia’s national savings were used to finance foreign investment, via very large trade surpluses and current account surpluses, rather than domestic investment. This is not necessarily disadvantageous in itself, but these large flows of foreign savings resulted in little wealth accumulation as a result of the general mismanagement of the surpluses, including bad portfolio investment, capital flight, and offshore leakages.
Again, the gap between Russia and China would be even larger if offshore wealth were not included in Russian national wealth calculations. Its inclusion is undoubtedly illuminating in helping readers to understand the evolution of wealth trends in Russia, but given that offshore wealth is largely out of the reach of the national government, its presence in Russian wealth calculations could also be argued to overestimate its tangible value for the country. In contrast, if the full value of cumulated trade surpluses in Russia’s national wealth were considered in estimations, then Russia’s national wealth-income ratio would have been at the same level as China’s by 2015, at around 700% of national income. The magnitude of change when including and excluding these factors illustrates the macroeconomic significance of this issue.
Finally, China’s national wealth-income ratios are higher than in Russia because relative asset prices have increased more in the former than the latter. In particular, Tobin’s Q ratios are much closer to one in China than in Russia.16 This means that the market value of wealth assets in China (that is, their price on the stock market) is much closer to their book value (that is, the value of assets based on the company’s balance sheet account; their assets minus liabilities) than in Russia, where these values were consistently very low. The interpretation of this finding may reflect a number different factors.
On the Chinese side, the key factor influencing Tobin’s Q ratio nearing one is the country’s restricted capital markets which limit the number of Chinese companies listed on the stock exchange.17 On the Russian side, there are a larger number of factors. One interpretation is that company stakeholder models have various actors other than shareholders—including worker representatives and sometimes regional government, share corporate decision-making power— which may reduce the market value of equity shares, but not necessarily the social value of companies. A less optimistic interpretation of low Q ratios, which may better fit the Russian case, is that there were ill-defined property rights and low protection of shareholder stakes in companies, not because of the benefit of other well-defined and potentially efficiency-enhancing stakeholders, but simply because the legal system is not working well. In addition, it could also be that this low market valuation reflects the importance of offshore assets and legal outsourcing in the management and control of Russian corporations. That is, Russian corporations are embedded into a complex nexus of contracts and offshore legal entities, of which the system of official shares ruled by the Russian legal system and traded on Moscow stock market is only the visible part.18
Understanding the evolution of public wealth in China and Russia
The ex-communist countries of China and Russia have followed the same general patterns of a declining overall share of public property in total wealth as rich countries in recent years, though starting from a much higher level of public wealth. In the ex-communist countries of China and Russia, the share of net public wealth fell from around 70% in 1980 to 35% and 20%, respectively, in 2015—a veritable turnaround in their public-private wealth ratios. As depicted by Figure 3.3.2, the share of net public wealth in net national wealth reversed in both China, from around 70%–30% in 1978 to 30%–70% in 2015, and in Russia, from 70%–30% to 20%–80% between 1990 and 2015. These recent figures for the countries’ public-private wealth ratios are not incomparable to those observed in the so-called “capitalist” countries during the mixed-economy period that followed the Second World War (1950–1980). But while these countries have ceased to be communist, in the sense that public ownership has ceased to be the dominant form of property, they still have much more significant public wealth than other capitalist countries. This is due both to low public debt and significant public assets—for instance, Russia’s energy sector. (Figure 3.3.3)
However, there are also strong differences between China’s and Russia’s experiences. The larger magnitude of the reversal in public-private wealth ratio in Russia, and its occurrence over a shorter time period, serves to underline the greater speed and depth of privatization in Russia relative to China. Indeed, this process is still continuing in China, and the public-private divide could even be stabilized at the current level if the Chinese authorities choose to do so. In contrast, Russia’s “shock therapy” approach to privatization was markedly different from that followed in China and other ex-communist countries. This contrast is evident in the period immediately after Russia’s transition toward a market economy commenced, from 1990 to 1995, when the fall in the share of net public wealth in net national wealth in Russia (70% to 35%) was five times larger than that in China (55% to 50%). Its implications for income inequality and wealth inequality are discussed in more detail in Part II and Part IV, respectively.
In contrast, the importance of foreign assets within China and Russia has been fairly similar since their transitions away from communist models, but have occurred for vastly different reasons. As illustrated by Figure 3.3.4, both countries have positive net foreign assets, meaning that the assets they own in the rest of the world are more valuable than those owned by foreigners in China and Russia, respectively. In Russia, this has largely been due to the country’s economic and natural endowments, given its large, but not necessarily permanent, natural resources, and has allowed the country to accumulate trade surpluses and foreign reserves for the future, as can also be observed in most oil-rich countries in the Middle East and elsewhere.
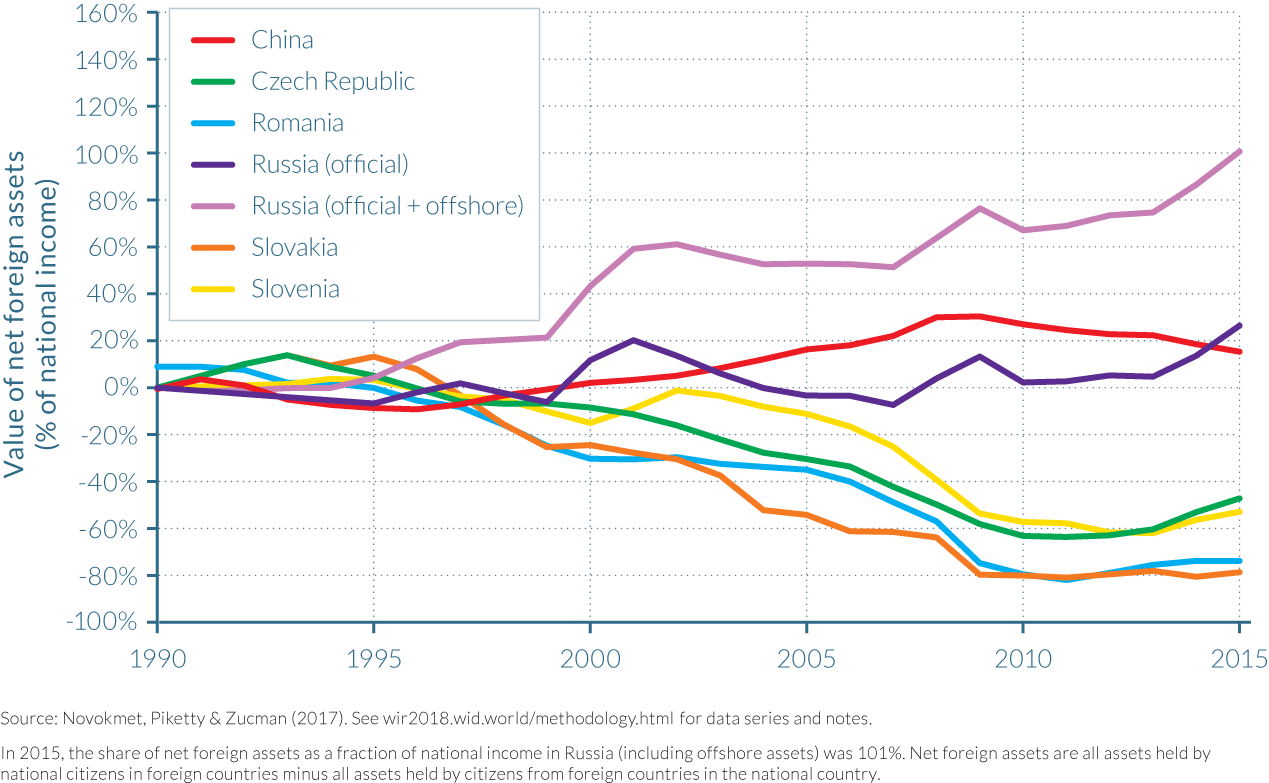
The accumulation of net foreign assets in China that are similar in magnitude to those of Russia should be viewed as much more striking, however, and indicate significant differences between the two countries. Chinese net foreign assets were accumulated in the absence of any significant natural resource endowment, and with much smaller trade surpluses of less than 3% of national income on average over the 1990–2015 period. In comparison, Russia’s trade surpluses averaged 10% of national income for the same period. This reflects more efficient management of trade surpluses and foreign reserves, which are viewed as critical for China’s economic and financial sovereignty by its Communist Party, and also the political choice of limiting foreign investors’ rights in China.
Differences in political institutions and ideologies seem to have played an even bigger role than purely economic factors in the evolution of wealth-national income ratios in China and Russia, and the share of the public and private sector within national wealth. As has already been stressed, the speed and depth of Russia’s privatization strategy was vastly different from the much slower and more gradual transition plan implemented by China, particularly the fire sale of Russian state-owned enterprises through the country’s voucher privatization scheme. Furthermore, differences in savings and investment incentives saw a significant proportion of Russian wealth leave the country to be held in offshore assets, while the overwhelming majority of Chinese wealth stayed within the country’s boundaries.
3.4 Capital Accumulation, Private Property, and Rising Inequality in China
Information in this chapter is based on “Capital Accumulation, Private Property and Rising Inequality in China, 1978–2015,” by Thomas Piketty, Li Yang, and Gabriel Zucman, 2017.
WID.world Working Paper Series (No. 2017/6).
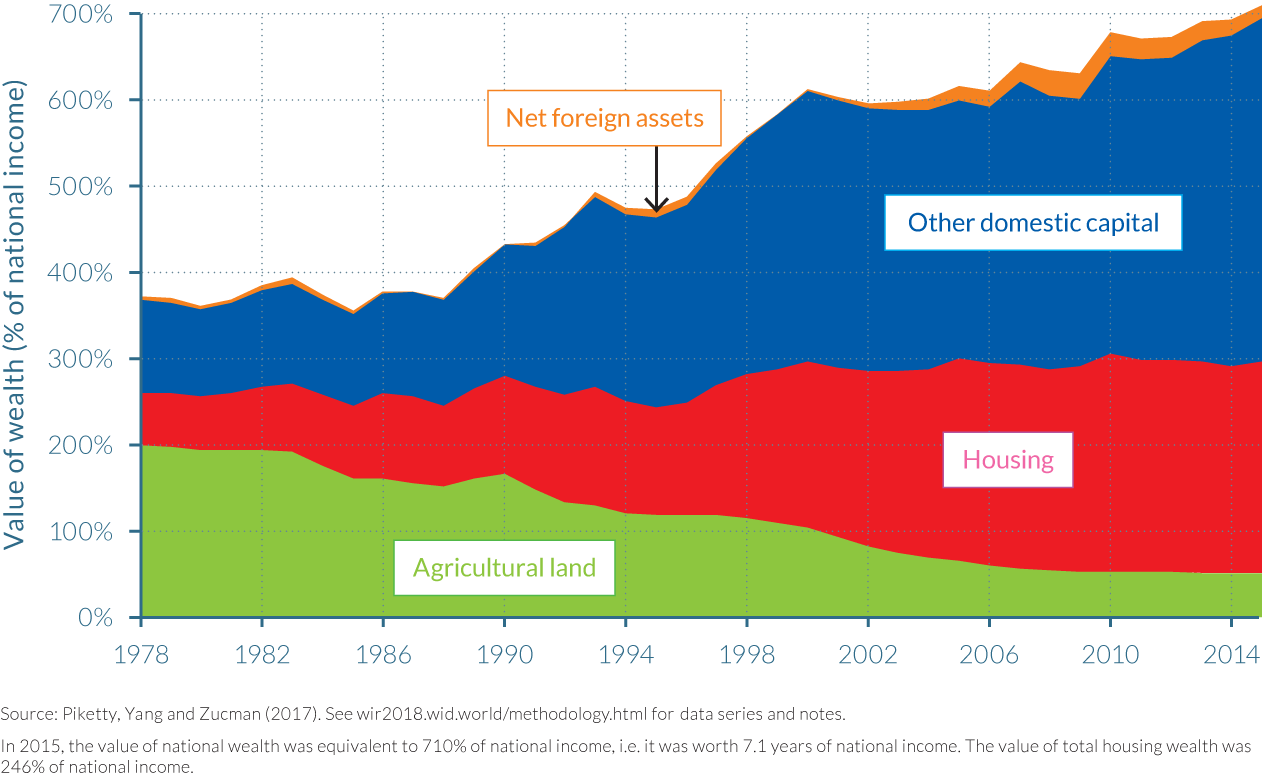
- While Chinese national wealth doubled in recent decades, from 350% to 700% of national income, its composition also changed dramatically. The share of agricultural wealth fell from close to half of total capital in the late-1970s to less than a tenth by the mid-2010s. By contrast, the privatization of the housing sector and the liberalization of capital markets saw the shares of housing and domestic capital dominate the make-up of China’s national wealth.
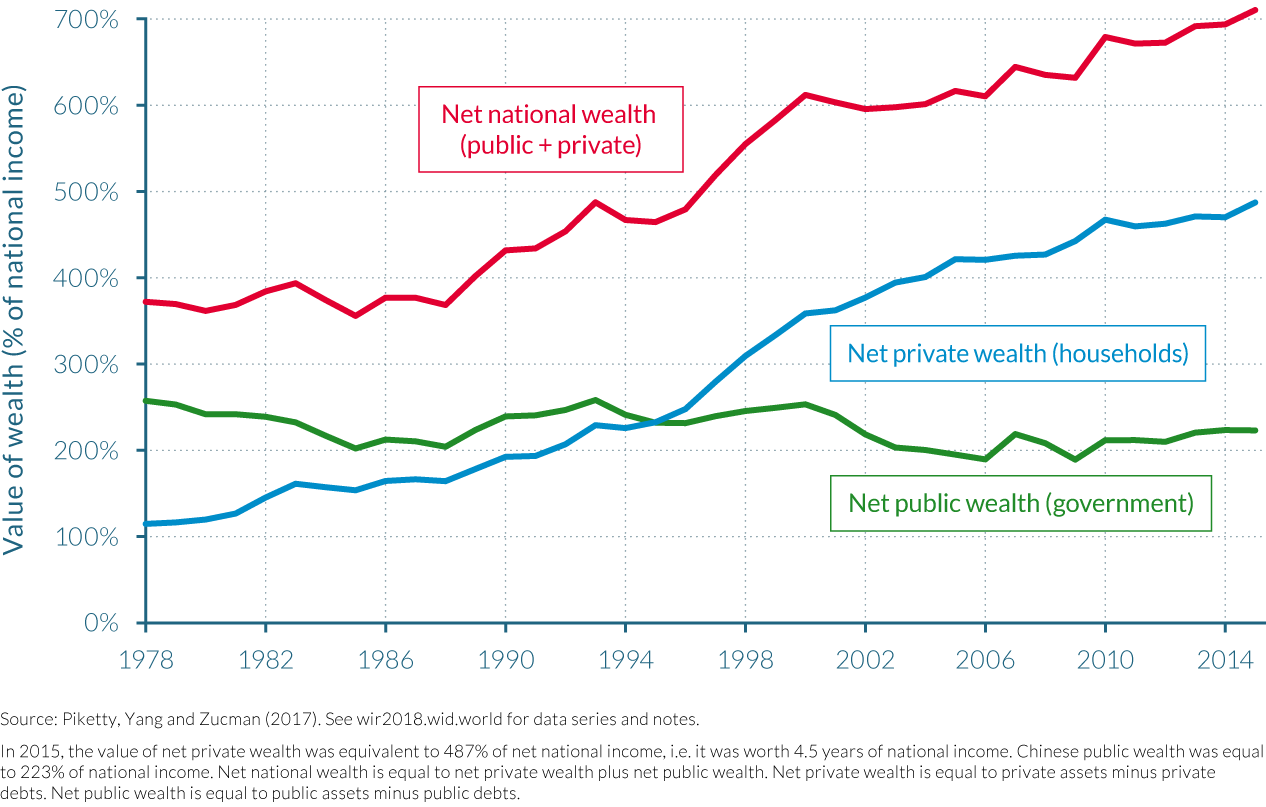
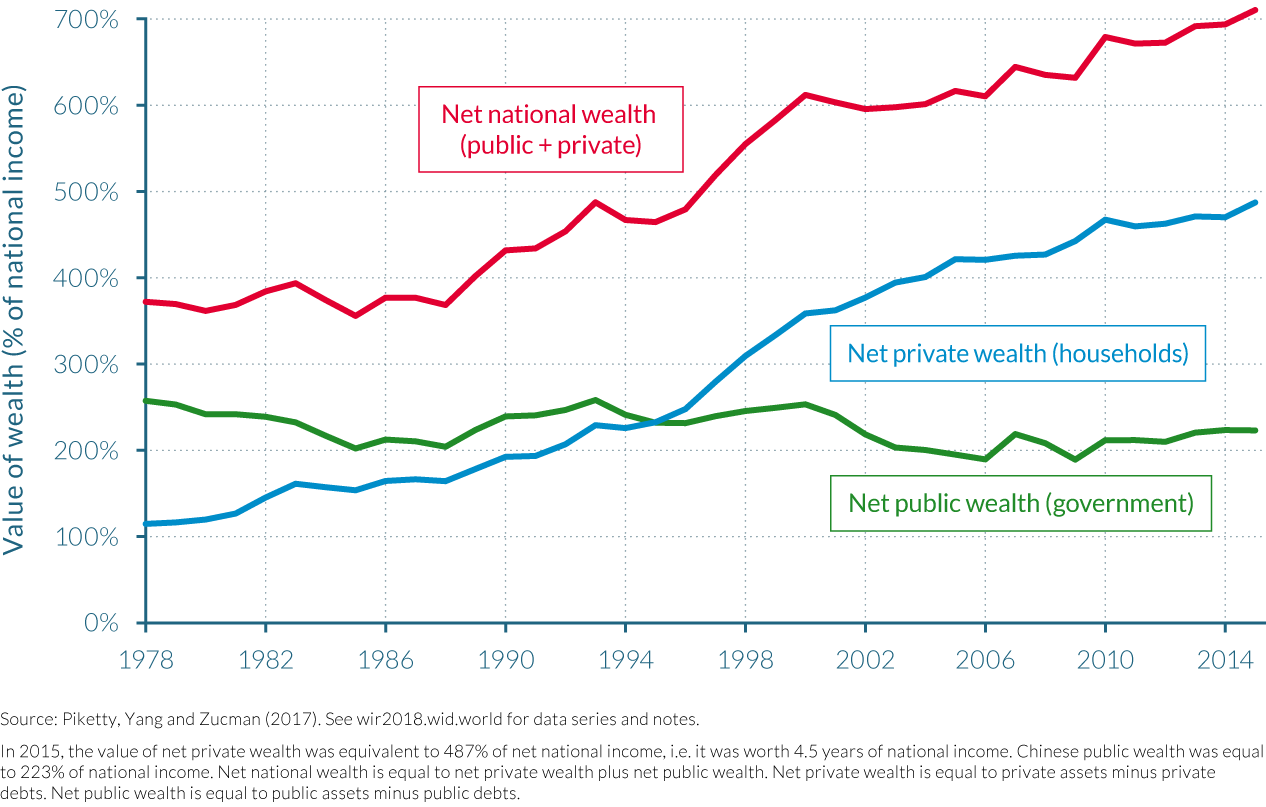
- Perhaps the most spectacular evolution has been in the division of national wealth between public and private wealth. Private wealth rose from around 100% of national income in 1978 to over 450% of national income in 2014, largely due to the privatization of housing stock, reaching a level close to those seen in France, the United States, and the UK.
- The balance of public and private wealth changed from a 70–30 proportional split of public-private assets in 1978 to a 35–65 split by 2015, but public wealth remained important as a share of national income, at around 250%. This level is high when compared to rich countries.
- High Chinese savings rates were an important driver of the rise in wealth accumulation, but according to simulations, they accounted for only 50% to 60% of the rise. The rest can be accounted for by increases in relative asset prices.
- China’s wealth accumulation was primarily driven by domestic capital accumulation. Chinese net foreign position, despite substantial growth since 2000, remains relatively modest compared to Japan or Germany. On the other hand, China remains more suspicious regarding foreign ownership of companies than Europe and North America.
China’s transition to a mixed economy led to a surge in national wealth and a radical change in its composition
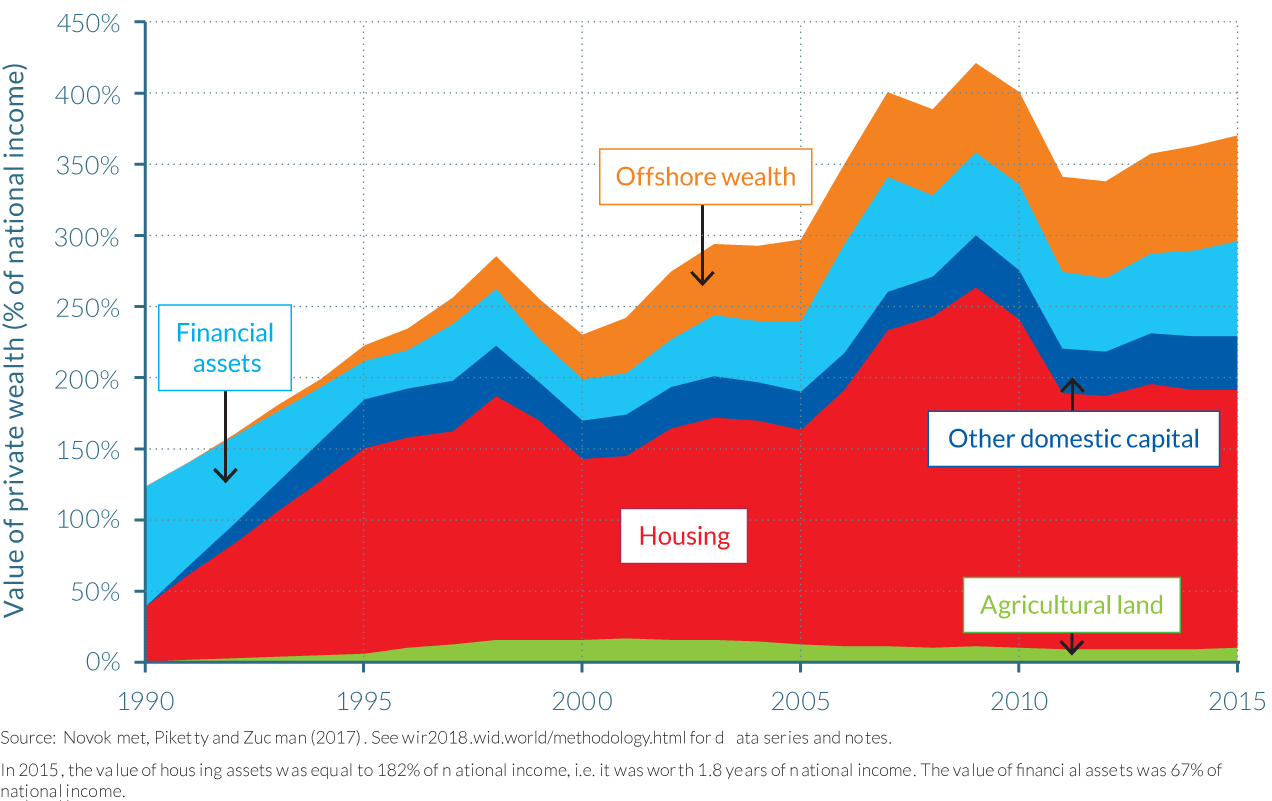
The Chinese wealth-national income ratio has increased substantially in recent decades. In 1978, national wealth as a percentage of national income was approximately 350%, but by 1993 this figure had reached 500% and grew to over 700% by 2015, as the composition of national wealth changed dramatically. The share of agricultural land used to make up almost half of total capital in 1978, but dropped sharply to less than a tenth of the total in 2015, as illustrated by Figure 3.4.1. In contrast, housing and other domestic capital wealth (buildings, equipment, machinery, patents, assets used by corporations, public administrations and households) increased enormously, in volume and in their share of the total: housing wealth increased from around 50% of national income in 1978 to approximately 200% in 2015, while other domestic capital grew to be the largest wealth component, rising from around 100% to over 350% between 1978 and 2015. Net foreign assets have also become a notable addition to China’s national wealth since the turn of the twenty-first century, amounting to approximately 25% of national income.
But perhaps the most spectacular evolution since the late 1970s has been the division of national wealth into private and public wealth (see Figure 3.4.2). Private wealth was relatively small in 1978, at around 100% of national income, but grew to represent over 450% of national income in 2014, while public wealth remained roughly stable, between 200% and 250% of national income over the period (first increasing slightly until 1993–1994 and then declining back to its initial level). As a result, the balance of public and private wealth in national wealth has altered enormously, with the 70–30 proportional split of public-private assets in 1978 reversed to a 35–65 split by 2015, as the country transitioned away from a communism-based economic model towards a mixed-form economy.
The extent of national wealth privatization in the Chinese economy differed, however, depending on the type of wealth asset, as can be seen in Figure 3.4.3. In the housing sector privatization was particularly comprehensive, with the private housing stock rising from roughly 50% to over 95% between 1978 and 2015, while for other forms of domestic capital the public share has declined but is still around 50%. Domestic equities (traded and non-traded), for example, were almost entirely owned by the state (95%) in 1978, but private ownership rose to around 30% by 2015, such that the government continues to own around a 60% share and foreign ownership accounts for the remaining 10%. Interestingly, the fraction of Chinese equities that are publicly owned dropped substantially until 2006, but seems to have stabilized—or even increased somewhat—since 2007.
Public assets remain substantial in China, unlike in most Western countries
The private wealth-national income ratio in China is now in the range of 450–500%, much closer to levels seen in most OECD countries. In the United States and the UK, the ratio is closer to 500% and 550–600%, respectively, but in China, public assets remain substantial unlike in these western countries where public wealth has become very small, or even negative, with public debt exceeding public assets. Indeed, the share of public property in China today is somewhat larger than, but by no means incomparable to, what it was in the West from the 1950s to the 1980s, and has recently appeared to have strengthened further: since the 2008 financial and economic crisis the public share in China’s mixed economy has seemingly increased and thus domestic capital accumulation has been one of the primary drivers of wealth growth in China.
The size and structure of China’s publicly-held wealth assets has large implications for economic development. The size of public property has important consequences for the state’s ability to conduct industrial and regional development policies; sometimes more efficiently and sometimes less so. It also has potentially considerable fiscal consequences, as governments with negative net public wealth typically have to pay large interest payments before they can finance public spending and welfare transfers, while those with large positive net public wealth can benefit from substantial capital incomes, enabling them to finance more public spending than would be possible through tax collection.
It is interesting to compare the evolution of the public share in national wealth in China and a resource-rich country with a large sovereign wealth fund such as Norway. These two countries have essentially switched positions: the public share in Chinese national declined from 70% to 30% between 1978 and 2015, while it rose from 30% to 60% in Norway over the same period (see Figure 3.4.4). A key difference between public wealth in Norway and China is that most of Norway’s public wealth is invested abroad. Norway’s large positive net public wealth generates capital income that is mostly used to finance further foreign capital accumulation, which in the long-run can be used to reduce taxes and to finance more public spending. In that sense, it is a very different form of public property than in China. Norwegian public property has therefore largely been accumulated for fiscal and financial purposes, rather than for industrial development and retaining a measure of control over the economy as seen in China. Norway’s sovereign fund has, however, also been used at times to promote certain policies, for example, regarding social and environmental objectives.
High savings rates and increases in relative asset prices drove wealth accumulation
High savings and investment rates over the period have been important drivers of Chinese wealth accumulation, but they are insufficient to account for the total increase in the country’s wealth—as it has also been the case for several rich countries. The other important element in understanding Chinese wealth accumulation is the rise of relative asset prices, in particular housing and equity prices that grew considerably more than the rise in consumer prices. As per the estimates of Thomas Piketty, Li Yang and Gabriel Zucman, savings explain 50% to 60% of the rise in the wealth-income ratio since 1978, while the increase in relative asset prices accounts for the remaining 40% to 50%.
Just as in rich countries, the rise in relative asset prices has been the result of a series of factors. First in this series of factors is the high taste preferences and demand for housing assets by Chinese households, which itself may be partly due to limited access to alternative savings and investment vehicles—Chinese citizens could not invest overseas, for example, and capital markets took time to develop—and also to insufficient awareness of expansions in the public pension system. A second important explanation involves changes in the legal system that reinforced private property rights including the lifting of rent controls, increases in the relative power of landlords over tenants and changes in the relative power of shareholder and workers within enterprises.
Decomposing wealth accumulation by sectors (private and public) and assets (financial and nonfinancial) in China over the period 1996–2015 provides interesting insights. When analyzing private wealth, there are clear differences between the returns on assets: strong, positive capital gains have been made by nonfinancial assets (231%), which centered around residential housing assets (163%), while there were only negligible capital gains for net financial wealth (1%). Conversely, there were strong capital gains for public financial assets (68%) and smaller gains for public nonfinancial wealth (19%). The majority of these large capital gains on public financial assets came from government-owned equities, and can be linked to the reform of state-owned enterprises that began in 2003 and the unprecedented wave of initial public offerings of state-owned enterprises that started in 2006. China also made notable capital losses on its net foreign assets, in part due to the appreciation of the yuan after 2004, explaining why despite its large current account surpluses, its net foreign asset position has increased only moderately (from -9% of national income in 2000 to 15% in 2015).
China, like Japan, seems more suspicious vis à vis foreign ownership than Europe or North America
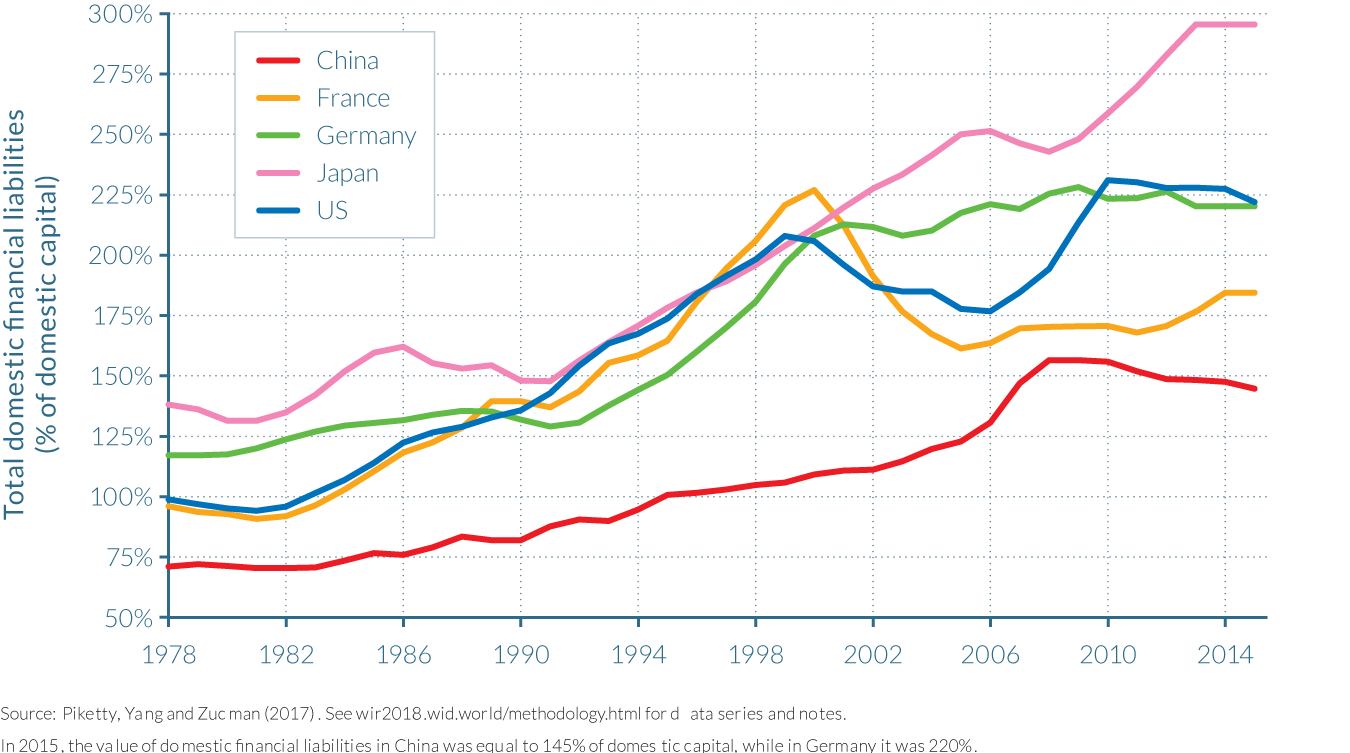
Domestic financial intermediation has also played a key role in the development of wealth in China over the last four decades. The ratio between total domestic financial liabilities—that is, total debt and equity issued by households, the government, and the corporate sector combined—and total domestic capital has risen from 60% in 1978 to 140% in 2015. This is a substantial rise given the limited financial development seen in China in the late 1970s. However, despite this financial development, the level of financial intermediation remains much lower in China than in many Western countries, where financial intermediation ratio roses from between 100–140% in 1978 to 200–300% in 2015, as depicted by Figure 3.4.5.
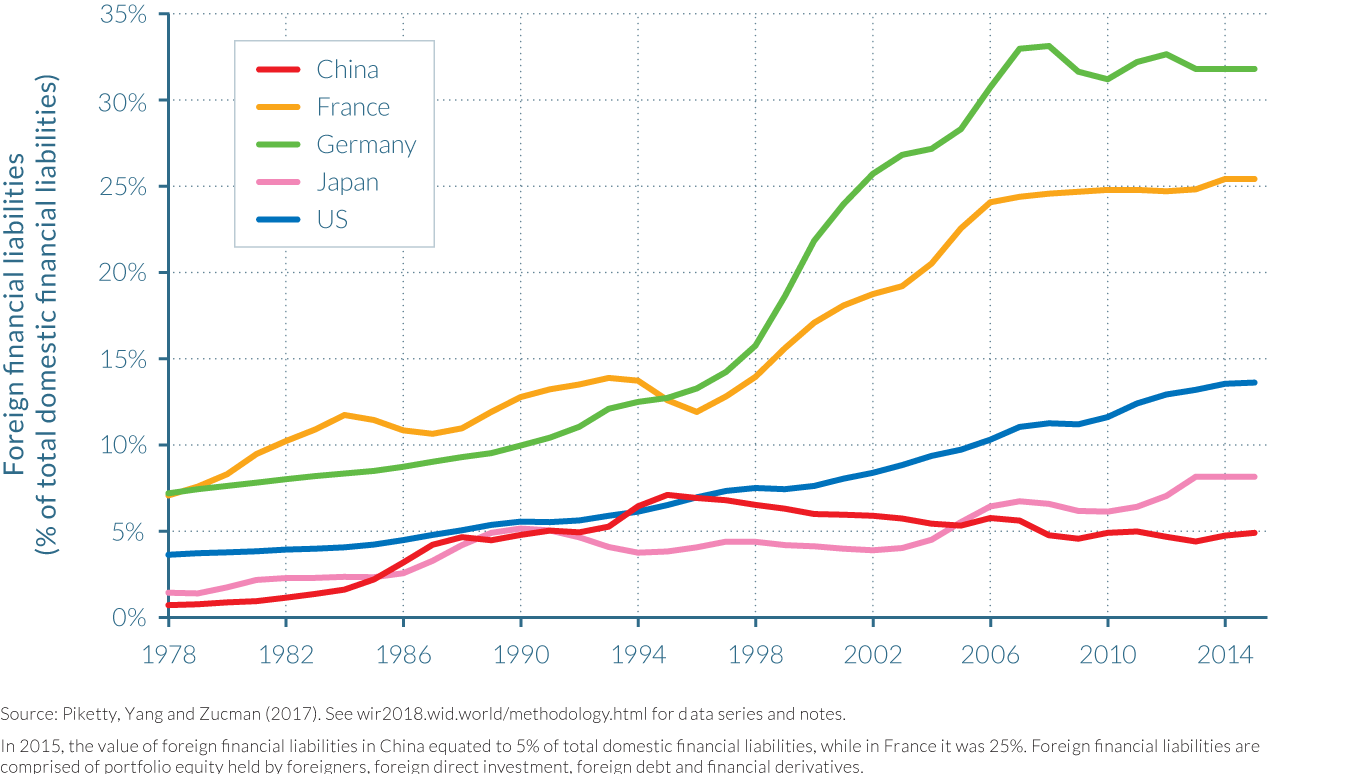
Foreign ownership of Chinese companies has not played a strong role in the rise of wealth, however. The fraction of domestic financial liabilities owned by the rest of the world reached only 5% in China in 2015, and has not past 7% across the whole observed period, as seen in Figure 3.4.6. Japan has the next smallest percentage of foreign ownership at 10% of domestic financial liabilities, followed by 15% in the United States and 25–30% in Germany and France. These differences partly reflect size effects: European countries are smaller, and if ownership were to be consolidated at the European level, the rest of the world would own only about 15% of European wealth (as in the United States). Even so, there does appear to be a tendency that some Asian countries—Japan and even more so China—are less open to foreign ownership than European and North American countries.
3.5 The Rise of Private Property in Russia
Information in this chapter is based on “From Soviets to Oligarchs: Inequality and Property in Russia 1905–2016,” by Filip Novokmet, Thomas Piketty, and Gabriel Zucman, 2017. WID.world Working Paper Series (No. 2017/10).
- Russia’s net national wealth-income rose moderately since the country’s transition from a communist to a capitalist economic model, increasing from around 400% in 1990 to 450% in 2015. At the same time, there have been significant fluctuations in the country’s wealth breakdown, as the shock therapy and voucher privatization strategy transferred enormous wealth at a very fast rate from the public to the private sector. Public wealth amounted to 300% of national income in 1990, but was just 100% in 2015.
- Private housing wealth represented by far the largest component of Russian private wealth in 2015. The gradual rise of housing can be accounted for by real-estate price movements and a privatization of the housing sector that was more gradual than the voucher privatization method used for companies.
- The very low level of official financial assets owned by Russian households—around 70–80% of national income throughout the 1990–2015 period—is particularly striking. This suggests that the privatization of Russian companies did not lead to any significant long-run rise in the value of household financial assets.
- However, discrepancies in Russia’s balance of payments allow researchers to estimate that a small number of Russian citizens had offshore wealth assets that amounted to 70% of national income in 2015, doubling the official value of financial assets. This is suspected to be the result of capital flight, made possible through weaknesses in Russia’s legal and statistical system.
Russia’s transition from public to private property
The evolution of aggregate private and public wealth in Russia has changed dramatically since the fall of the Soviet Union. As the country transitioned from a communist to capitalist model after 1990, public property was transferred to the private sector. Net national wealth amounted to slightly more than 400% of national income in 1990, roughly three-quarters of which was owned by the state and one-quarter by private individuals. But by 2015, these proportions reversed, as illustrated by Figure 3.5.1. Net private wealth amounted to 350% of national income, while net public wealth represented less than 100%; the overall national wealth to national income ratio had increased by just 12% over 25 years. Furthermore, this dramatic fall in Russia’s net public wealth occurred over just a few years, between 1990 and 1995, as the country implemented its so-called shock therapy transition strategies, which included the privatization of state-owned enterprises through vouchers.19 (More on this will be addressed in Part IV of the report.)
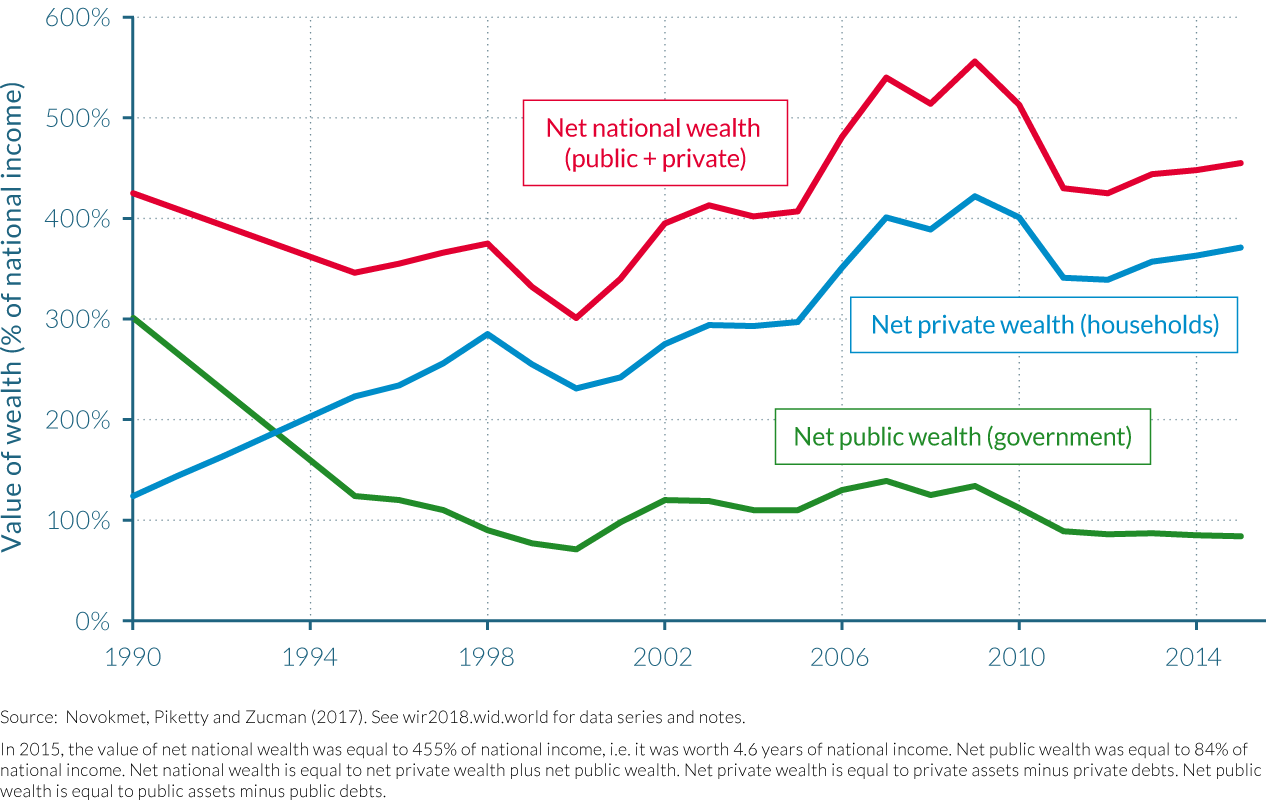
It is noteworthy that aggregate national wealth fell relative to national income in the initial stages of Russia’s transition. As can be seen on Figure 4.3.1, net national wealth decreased between 1990 and 1999, from over 400% of national income to about 300%, such that aggregate national wealth fell even more than national income over this period, which almost halved itself. National wealth rose then considerably between 1999 and 2009, reaching about 550% of national income. This peak corresponded to a very large rise of Russian stock market prices and housing prices during this decade, but as asset prices then fell in the aftermath of the financial crisis, aggregate national wealth fell back to around 450% of national income in 2015, only just above its value 25 years previously. As a consequence, the major transformation during the 1990–2015 period was the shift from public to private property, rather than any significant and sustained increase in the aggregate value of national wealth.
Private housing has risen to dominate private wealth in Russia
In order to better understand which factors influenced the evolution of national wealth-income ratios in Russia and the composition of the country’s wealth, it is critical to look separately at the different asset categories. As seen in Figure 3.5.2, there was a significant rise in private wealth since 1990.20 Housing played a critical role here as property prices more than doubled between the year 2000 and the peak of the housing bubble in 2008–2009, increasing the value of housing wealth from less than 50% of national income in 1990 to 250% at its peak, before easing to approximately 200% by 2015. Comparatively, other domestic capital (mostly consisting of unincorporated businesses owned directly by households) and agricultural land (which was also largely privatized during the 1990s) increased over time, but these assets played a relatively limited role as compared to the rise of private housing.
In addition to real estate price movements, the gradual rise of private housing wealth between 1990 and 2015 can be accounted for by the more continuous manner in which housing privatization occurred, relative to the voucher privatization method used for companies. Tenants were typically given the right to purchase their housing unit at a relatively low price, but they did not need to exercise this right immediately. Due to various economic, political and psychological factors, many Russian households waited until the late 1990s and even the 2000s to exercise this right. Indeed, some were concerned about the possible maintenance costs associated to private ownership as under public housing ownership maintenance work was taken care of by public authorities, while others were more concerned about a possible political downturn, particularly following the presidential election of 1996 when Boris Yeltsin won with a relatively small margin against communist party leader Gennady Zyuganov.
Official household financial assets are particularly low in Russia, due largely to the voucher method chosen to privatize former state-owned enterprises
What is also particularly striking is the very low level of official financial assets owned by Russian households attained in official Rosbank financial balance sheets and other official sources. Household financial assets have always been less than 70–80% of national income throughout the 1990–2015 period, and they have often been less than 50% of national income; in the late 1990s and early 2000s, they were as little as 20–30% of national income. Thus, it is as if the privatization of Russian companies did not lead to any significant long-run rise in the value of household financial assets, in spite of the fact that it had become possible for individuals to own financial shares in Russian firms. This appears particularly paradoxical.
The initial decline in financial assets was perhaps predictable. Back in 1990, household financial assets—which at the time mostly consisted of saving accounts—amounted to about 70–80% of national income. But as prices were liberalized in the early 1990s, these Soviet-era savings were all but eradicated by hyperinflation. The consumer price index was multiplied by nearly 5000 between 1990 and 1996, with annual inflation rates consistently above 150% and as high as 1 500% in 1992 and 900% in 1993. Following the introduction of the new ruble—worth 1 000 old rubles—in 1998, the inflation rate stabilized at around 20–30% per year on average up to 2006.
What is more surprising is why the new financial assets that were accumulated by Russian households during the 1990s—in particular through voucher privatization—did not compensate for this loss in savings. Of course, when vouchers were first introduced in 1992–1993, it was very difficult for Russian households to know what to do with these new financial instruments and how to put a price on them. More generally, it could be argued that in the chaotic monetary and political context of the 1990s it is not too surprising that the market value of household financial assets remained relatively low until the somewhat more stable mid- to late-1990s. What is more difficult to understand, however, is why such extremely low valuations persisted well after this period. In particular, in spite of the spectacular Russian stock market boom that occurred between 1998 and 2008, it is conspicuous that total financial assets officially owned by Russian households amounted to little more than 70% of national income in 2008—that is, less than the level observed in 1990.
Taking into account offshore wealth doubles Russia’s total official financial assets
In the view of Filip Novokmet, Thomas Piketty, and Gabriel Zucman, the main explanation for this paradox is the existence of a small subset of Russian households that own very substantial offshore wealth—that is, nonofficial financial assets in offshore tax havens. According to their benchmark estimates, offshore wealth has gradually increased between 1990 and 2015, representing approximately 75% of national income at the end of the period. As depicted by Figure 3.5.2, offshore wealth was thus roughly as large as official financial assets owned by Russian households. By definition, offshore assets are difficult to estimate, and the benchmark estimates presented in this section are neither precise nor fully satisfactory, but these orders of magnitude seem to be reasonable, and if anything may be somewhat underestimated given the way in which they are constructed, as explained below.
In order to estimate the rise and magnitude of offshore wealth held by Russian households, it is natural to start by looking at the evolution of Russia’s trade balance and its balance of payments. Examining these two balances together, there is a clear contrast between the very large trade surpluses recorded in Russia and the country’s relatively modest foreign assets, as illustrated by Figure 3.5.3.
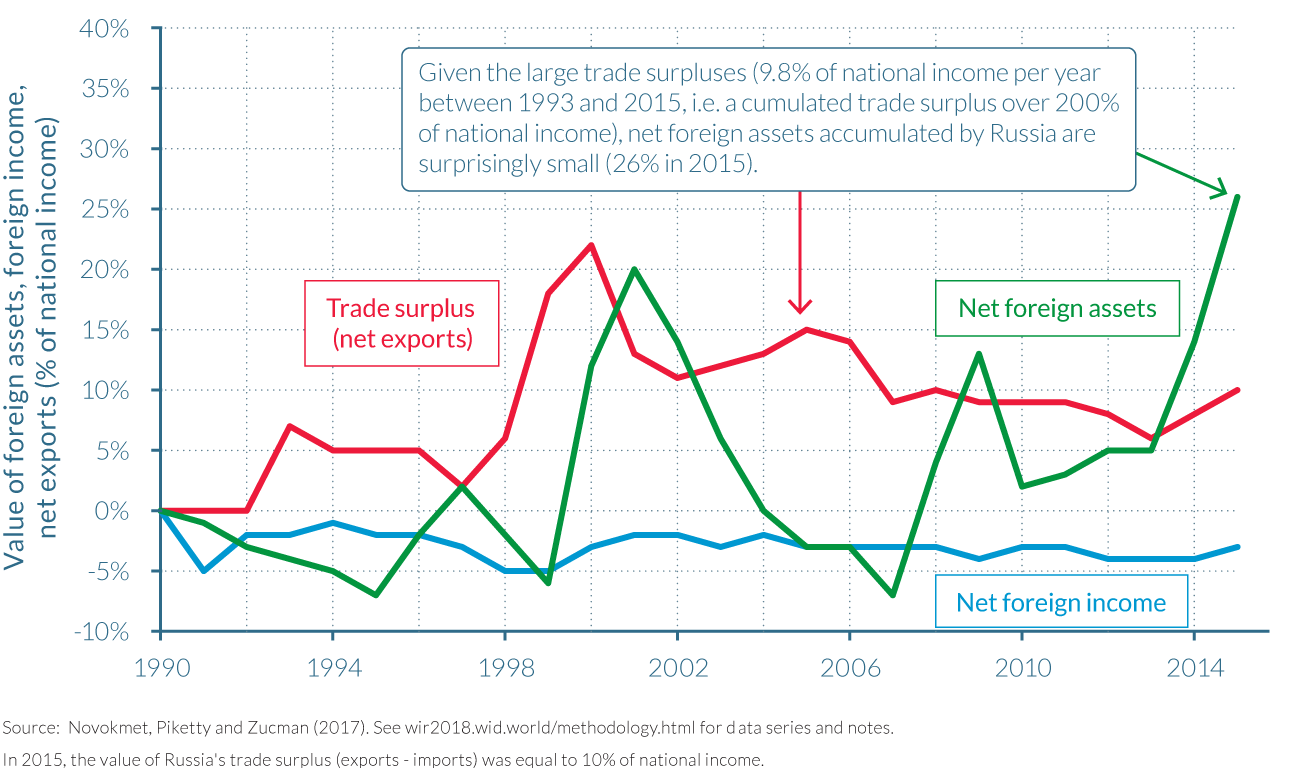
Russia has had strong trade surpluses each single year since the early 1990s. These trade surpluses—mostly driven by exports in oil and gas—averaged almost 10% of national income between 1993 and 2015, having been at around 5% between 1993 and 1998, and as much as 20% in 1999–2000. Thus, in each of the last 20 years, the Russian economy has exported the equivalent of around 10% of its annual income in excess of what the country has imported. Given that Russia’s initial financial position when beginning its transition was close to zero, with very few foreign assets or foreign debt, these sustained surpluses should have led to a massive accumulation of foreign assets held by Russian citizens in the rest of the world. However, the paradox is that net foreign assets accumulated by Russia are surprisingly small at about 25% of national income in 2015.
Investigating Russia’s balance sheet reveals further inconsistent information regarding the ownership of financial assets. Both foreign assets (that is, assets owned by Russian residents in the rest of the world) and foreign liabilities (that is, assets owned by rest-of-the-world residents in Russia) have increased significantly since the fall of the Soviet Union. Both were extremely small in 1990, at around 10% of national income, reflecting low levels of financial integration with the rest of the world and strong capital controls. But by 2015, foreign assets had reached almost 110% of national income, and foreign liabilities were close to 85% of national income, hence a net foreign asset position of about 25% of national income.
How can such a low level of net foreign wealth accumulation be accounted for? An obvious explanation is capital flight: some Russian individuals, and/or some Russian corporations acting on behalf of individuals, and/or some Russian government officials acting on behalf of individuals, were able to appropriate some of Russia’s trade surpluses to accumulate offshore wealth—that is, foreign assets that are not properly recorded as such in Russia’s official financial statistics. Given the weaknesses of Russia’s legal and statistical system, and the widespread use of offshore entities to organize business and financial transactions in Russia over this period, it is maybe not too surprising that such leakages might have occurred.21
Discrepancies in Russia’s balance of payments can aid estimations of the country’s offshore wealth
How large these capital flight leakages are, and the associated accumulation of offshore wealth is, are challenging to measure. Simple calculations of trade surpluses (230%) minus official net foreign assets (30%) over the 1990–2015 period, would suggest that cumulated capital flight is on the order of 200% of national income. But this does not include the cumulated capital income flow on these foreign assets, which could have been significant if rates of return on these assets were high. Indeed, it appears that returns on foreign assets were lower than the returns on foreign liabilities over the 1990–2015 period, as illustrated by the small negative net foreign income flows in Figure 3.5.3. This net capital income outflow hence absorbed approximately a quarter to a third of Russia’s annual trade surplus.
Furthermore, the capital gains and losses realized on the portfolio of foreign assets and liabilities needs to be accounted for. These portfolio effects can be substantial if there are large differences between annual surpluses and the observed evolution of net foreign assets. This is partly what happened in Russia as foreign investors bought Russian assets in the 1990s when stock market prices were extremely low and benefited from the country’s booming stock market of the 2000s, providing part of the explanation as to why foreign liabilities rose as much as Figure 3.5.4 shows. These portfolio effects therefore imply that a substantial part of Russia’s trade surpluses was translated into assets held by citizens from elsewhere in the world. But the magnitude of the aforementioned differentials in rates of return and portfolio effects were not large enough to fully explain the missing wealth paradox.
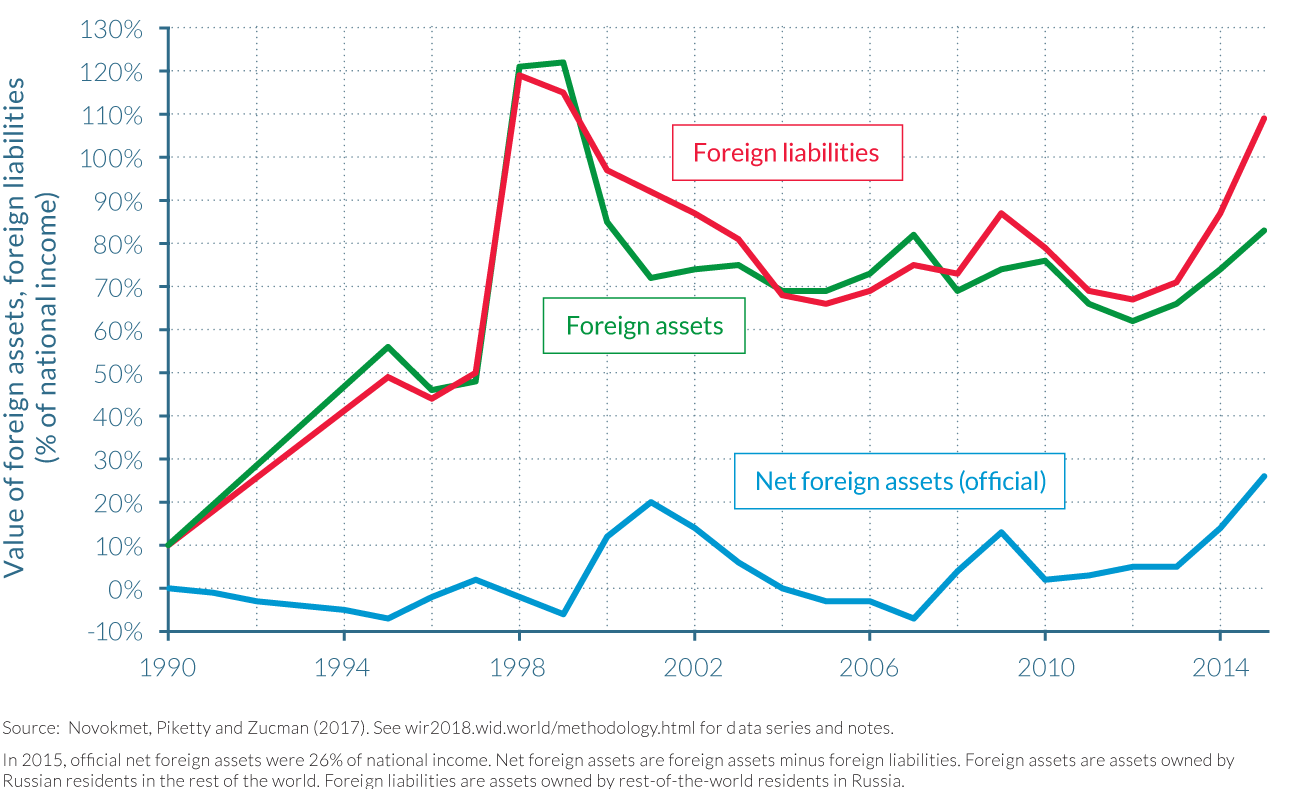
Filip Novokmet, Thomas Piketty, and Gabriel Zucman therefore look to exploit inconsistencies in Russia’s balance of payments to estimate the size of offshore wealth—that is, Russia’s missing foreign assets. Their relatively conservative estimations indicate that offshore wealth reached approximately 75% of national income by 2015, suggesting that Russians own approximately as much offshore wealth as their official financial asset holdings (about 70–80% of national income in both cases). That is, they own about 50% of their total financial wealth offshore. These results are similar to estimates obtained by Gabriel Zucman’s earlier research that used a different methodological approach.22 Thus they can be viewed as somewhat reassuring. But while these magnitudes are believed to be broadly accurate, these estimations lack absolute precision given the general lack of international financial transparency—and the difficulties of identifying by whom these missing assets are owned and what form they take potentially pose even greater challenges.
Even more uncertain is the location of the assets held offshore by Russian citizens. Some of this offshore wealth might be invested back in Russian corporations, while it is also discussed that some Russians own significant property assets in cities such as London and in the countryside of nations such as French, and/or have large shares in companies and in sports teams in countries such as Germany, the UK, and the United States. Inspecting the list of Russian billionaires released by Forbes illustrates that these individuals collectively own more than $400 billion in assets—that is, the equivalent of about half of the estimated $800 billion in Russian offshore wealth. Comparing the corresponding wealth portfolios published by Forbes and other magazines, one could be tempted to conclude that most of the offshore wealth is held in Russian companies, in particular in the energy and financial sectors. On this basis, interpretations of the available data indicate that a large fraction of Russia’s official foreign liabilities—over 80% of national income in 2015—is actually held by Russian residents via offshore accounts. But given that the Forbes list does not provide any information regarding the fraction of reported billionaire wealth held offshore—likely a very large proportion—it is difficult to provide more conclusive explanations.
NOTES
- T. Piketty and G. Zucman, “Capital Is Back: Wealth-Income Ratios in Rich Countries 1700–2010,” Quarterly Journal of Economics 129, no. 3 (2014): 1255–1310.
- T. Piketty, Capital in the Twenty-First Century (Cambridge, MA: Belknap Press of Harvard University Press, 2014).
- A. Atkinson, Inequality: What Can Be Done? (Cambridge, MA: Harvard University Press, 2015).
- T. van den Bremer, F. van der Ploeg, and S. Wills, “The Elephant in the Ground: Managing Oil and Sovereign Wealth,” European Economic Review 82 (2016): 113–-131.
- See Piketty and Zucman, “Capital Is Back,” for a complete analysis and decomposition of volume and price effects. See also Piketty, Capital in the Twenty-First Century, part 2. Here we summarize only the main conclusions and emphasize the more recent evolutions.
- See Piketty and Zucman, “Capital Is Back.”
- See Piketty and Zucman, “Capital Is Back,” in particular Figures VII and VIII.
- See Piketty and Zucman, “Capital Is Back.”
- J. Tobin and W. C. Brainard, “Asset Markets and the Cost of Capital,” in Economic Progress, Private Values and Public Policy, ed. B. Balassa and R. Nelson, 235–262 (Amsterdam: Elsevier North Holland, 1977).
- In Germany, book-value national wealth was substantially above market-value national wealth (about 5 years of national income instead of 4 years) between 1970 and 2010. The opposite occurred in the UK over this period
- Annette Alstadsæter, Niels Johannesen, and Gabriel Zucman find that the equivalent of 10% of world GDP is held in tax havens globally, but this average masks a great deal of heterogeneity—from a few percent of GDP in Scandinavia, to about 15% in Continental Europe, to about 60% in Gulf countries and some Latin American economies. See A. Alstadsæter, N. Johannesen, and G. Zucman, “Who Owns the Wealth in Tax Havens? Macro Evidence and Implications for Global Inequality,” NBER Working Paper no. 23805, National Bureau of Economic Research, September 2017, http://www.nber.org/papers/w23805.pdf..
- See Piketty and Zucman, “Capital Is Back,” Table VII.
- See Piketty and Zucman, “Capital Is Back,” Table VIII.
- See T. Piketty, “On the Long-Run Evolution of Inheritance: France 1820–2050,” Quarterly Journal of Economics 126, no. 3 (2011): 1071–1131; and T. Piketty and E. Saez, “A Theory of Optimal Inheritance Taxation,” Econometrica 81, no. 5 (2013):1851–1886.
- See G. Zucman, “Taxing across Borders: Tracking Personal Wealth and Corporate Profits,” Journal of Economic Perspectives 28, no. 4 (2014): 121–148; and Alstadsæter, Johannesen, and Zucman, “Who Owns the Wealth in Tax Havens?”
- See T. Piketty, L. Yang, and G. Zucman, “Capital Accumulation, Private Property and Rising Inequality in China, 1978–2015,” NBER Working Paper no. 23368, National Bureau of Economic Research, June 2017, http://www.nber.org/papers/w23368.pdf, for a detailed volume-price decompositions of China’s wealth accumulation.
- Piketty, Yang and Zucman, in “Capital Accumulation,” estimate Tobin’s Q of these Chinese companies that are not listed on the stock exchange to be 1. Given that these not listed companies represent approximately 80% of all Chinese companies, this has a tendency to move the average Tobin’s Q toward 1.
- See D. Nougayrède, “Outsourcing Law in Post-Soviet Russia,” Journal of Eurasian Law 6, no. 3 (2013): 383–448; D. Nougayrède, “Yukos, Investment Round-Tripping and the Evolving Public/Private Paradigms,” American Review of International Arbitration 26, no. 3 (2015): 337–364; and D. Nougayrède, “The Use of Offshore Companies in Emerging Market Economies: A Case Study,” Columbia Journal of European Law 23, no. 2 (2017): 401–440.
- One key argument behind the shock therapy doctrine was that rapid privatization would prevent any possible return to public property and communism. See, for example, M. Bojko, A. Shleifer, and R. W. Vishny, Privatizing Russia (Cambridge, MA: MIT Press, 1995).
- Note, however, a fall in aggregate national wealth right after the fall of communism, not presented here to simplify the interpretation over the 1990 to 2015 period.
See, for example, the work by legal experts, such as Nougayrède, “Outsourcing Law in Post-Soviet Russia”; Nougayrède, “Yukos, Investment Round-Tripping”; and Nougayrède, “The Use of Offshore Companies.” - See G. Zucman, “The Missing Wealth of Nations: Are Europe and the US Net Debtors or Net Creditors?” Quarterly Journal of Economics 128, no. 3 (2013): 1321–1364; G. Zucman, “Taxing across Borders: Tracking Personal Wealth and Corporate Profits,” Journal of Economic Perspectives 28, no. 4 (2014): 121–148;; and G. Zucman, The
- Hidden Wealth of Nations: The Scourge of Tax Havens, trans. T. L. Fagan (Chicago: University of Chicago Press, 2015).