5.1 What is the future of global income inequality?
- The future of global income inequality is likely to be shaped by both convergence forces (rapid growth in emerging countries) and divergence forces (rising inequality within countries). No one knows which of these forces will dominate and whether these evolutions are sustainable.
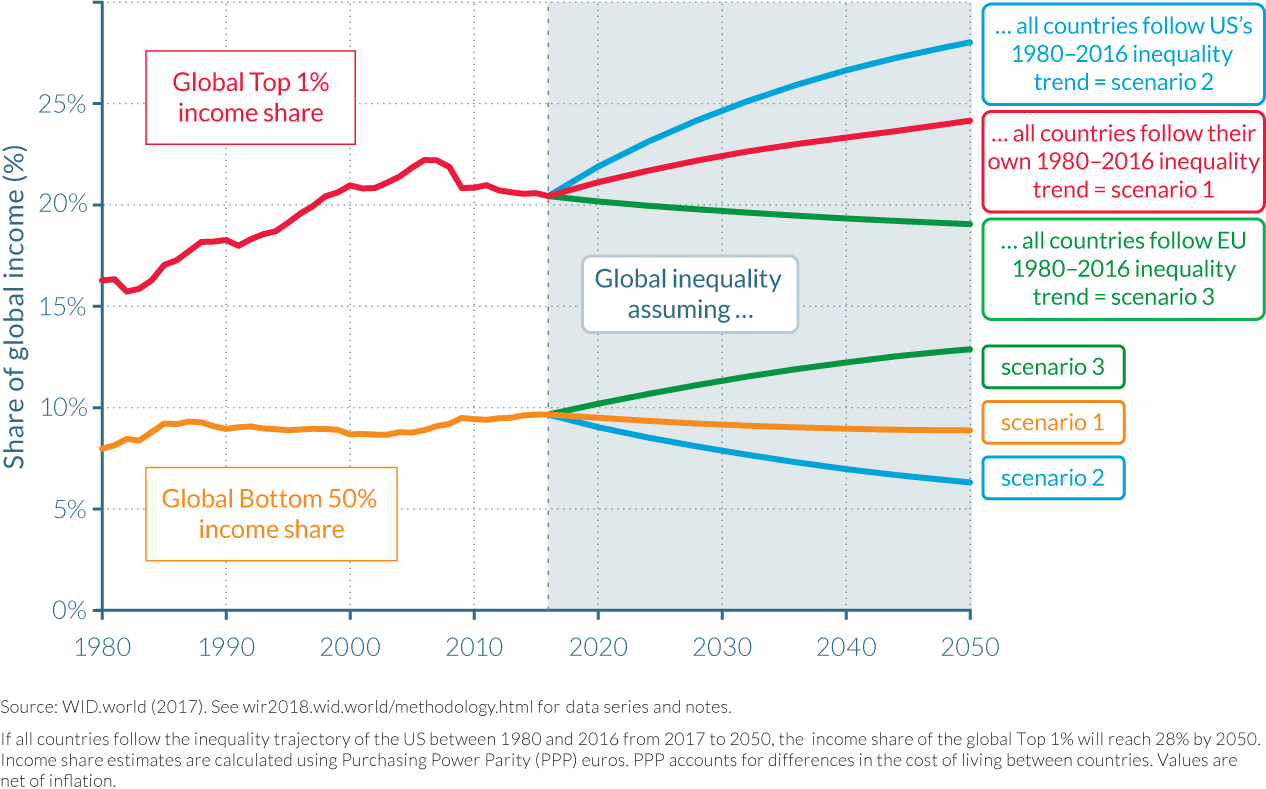
- However, our benchmark projections show that if within-country inequality continues to rise as it has since 1980, then global income inequality will rise steeply, even under fairly optimistic assumptions regarding growth in emerging countries. The global top 1% income share could increase from nearly 20% today to more than 24% in 2050, while the global bottom 50% share would fall from 10% to less than 9%.
- If all countries were to follow the high inequality growth trajectory followed by the United States since 1980, the global top 1% income share would rise even more, to around 28% by 2050. This rise would largely be made at the expense of the global bottom 50%, whose income share would fall to 6%.
- Conversely, if all countries were to follow the relatively low inequality growth trajectory followed by Europe since 1980, the global top 1% income share would decrease to 19% by 2050, while the bottom 50% income share would increase to 13%.
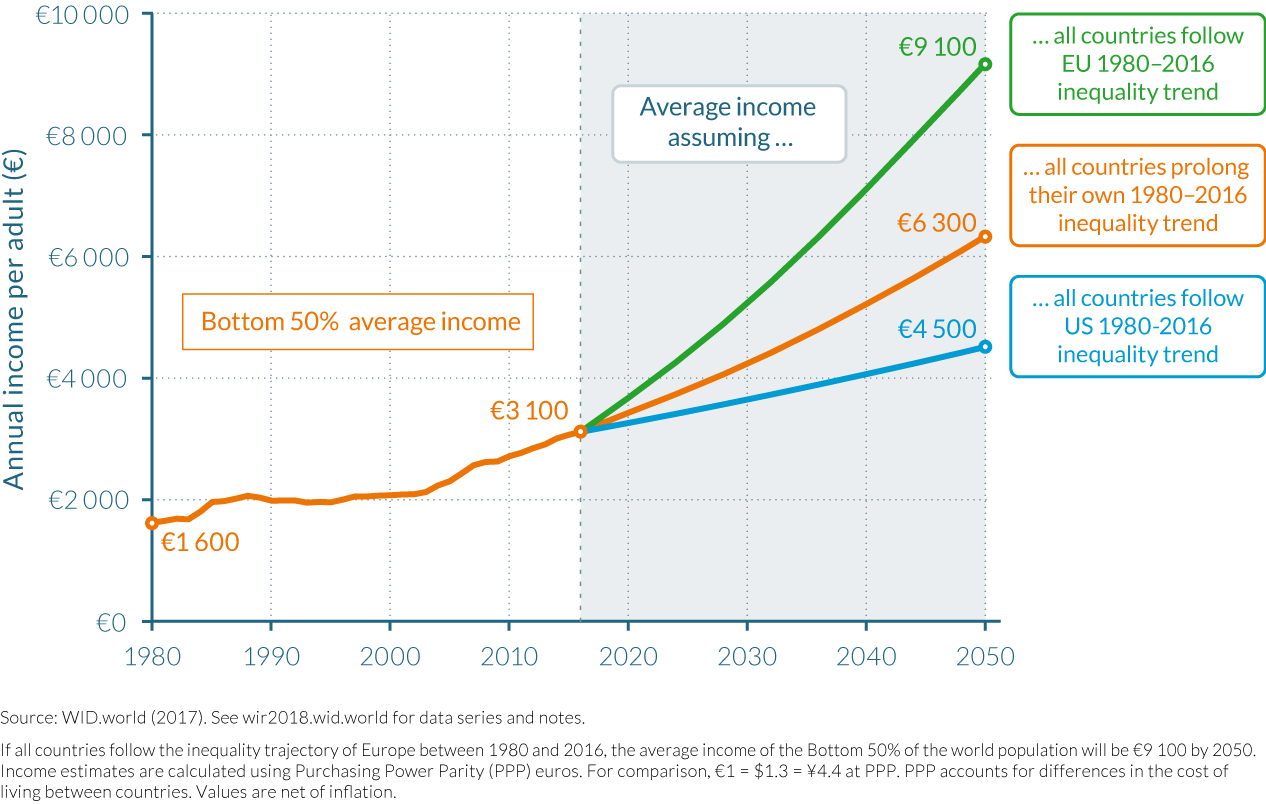
- Differences between high and low inequality growth trajectories within countries have an enormous impact on incomes of the bottom half of the global population. Under the US-style, high inequality growth scenario, the bottom half of the world population earns €4 500 per adult per year in 2050, versus €9 100 in the EU-style, low inequality growth scenario (for a given global average income per adult of €35 500 in 2050 in both scenarios).
The past four decades have been marked by steeply rising income inequality within countries. At the global level, inequality has also risen sharply since 1980, but the situation more or less stabilized beginning in the early 2000s. What will happen in the future? Will growth in emerging countries lead to a sustained reduction in global income inequality? Or will unequal growth within countries drive global income inequality back to its 2000 levels? In this chapter, we discuss different possible global income inequality scenarios between now and 2050.
The projections of global wealth inequality presented in the previous chapter showed that the continuation of current unequal rates of growth among wealth groups would lead to a compression of the global middle-class wealth share and a further rise in wealth inequality. These projections must, however, be interpreted with great care; only China, Europe, and the United States are included in the analysis of the previous chapter given large limitations in wealth inequality data.
Fortunately, more data are available to measure income inequality, and in this chapter we present more elaborate projections of global income inequality. Before discussing the results, it is necessary to stress what can and cannot be reliably projected. As the saying goes, “all models are wrong; some are useful.” Our projections are attempts to represent possible states of global inequality in the future, so as to better understand the role played by key determinants. The purpose of our projections is not to predict the future. The number of forces (or variables) that we consider in our analysis is limited. This makes our projections straightforward and simple to understand, but also limits their ability to predict the future. Our projections of global income inequality dynamics are based on the modeling of three forces: within-country income inequality, national level total income growth, and demographics.
One of the key questions we seek to address is the following: will between-country convergence—that is, Asian, African, and Latin American countries catching up with rich countries—dominate in the future and lead to a reduction of global income inequality? Or will forces of divergence (the increase of inequality within countries) take over? Demographic dynamics are also important to take into account. Fast population growth in countries where inequality is rising, for instance, will tend to accentuate global divergence. It is difficult to say which of these forces will dominate a priori. Such an exercise can thus help us understand under what conditions different outcomes might result.
Defining three scenarios to project global income inequality up to 2050
Three scenarios are defined to project the evolution of inequality up to 2050. All our scenarios run up to the halfway mark of the twenty-first century; this has us looking out at a time span similar to the one that has passed since 1980—the starting date of our analyses in the previous chapters. Our first scenario represents an evolution based on “business as usual”—that is, the continuation of the within-country inequality trends observed since 1980. The second and third are variants of the business-as-usual scenario. The second scenario illustrates a high within-country inequality trend, whereas the third scenario represents a low within-country inequality trend. All three scenarios have the same between-country inequality evolutions. This means that a given country has the same average income growth rate in all three scenarios. It also has the same population growth rate in all three scenarios. For estimations of future total income and population growth we turned to the OECD 2060 long-term forecasts.1 We also relied on the United Nations World Population Prospects.2
In the first scenario, all countries follow the inequality trajectory they have followed since the early 1980s. For instance, we know that the bottom 50% income earners in China captured 13% of total Chinese growth over the 1980–2016 period.3 We thus assume that bottom 50% Chinese earners will capture 13% of Chinese income growth up to 2050. The second scenario assumes that all countries follow the same inequality trajectory as the United States over the 1980–2016 period. Following the above example, we know that bottom 50% US earners captured 3% of total growth since 1980 in the United States. The second scenario then assumes that within all countries, bottom 50% earners will capture 3% of growth over the 2017–2050 period. In the third scenario, all countries follow the same inequality trajectory as the European Union over the 1980–2016 period—where the bottom 50% captured 14% of total growth since 1980.
Under business as usual, global inequality will continue to rise, despite strong growth in low-income countries.
Figure 5.1.1 shows the evolution of the income shares of the global top 1% and the global bottom 50% for the three scenarios. Under the business-as-usual scenario (scenario 1), the income share held by the bottom 50% of the population slightly decreases from approximately 10% today to less than 9% in 2050. At the top of the global income distribution, the top 1% income share rises from less than 21% today to more than 24% of world income. Global inequality thus rises steeply in this scenario, despite strong growth in emerging countries. In Africa, for instance, we assume that average per-adult income grows at sustained 3% per year throughout the entire period (leading to a total growth of 173% between 2017 and 2050).
These projections show that the progressive catching-up of low-income countries is not sufficient to counter the continuation of worsening of within-country inequality. The results also suggest that the reduction (or stabilization) of global income inequality observed since the financial crisis of 2008, discussed in Chapter 2, could largely be a short-run phenomenon induced by the shocks on top incomes, and the growth slowdown in rich countries (particularly in Europe).
In scenario two, future global income inequalities are amplified as compared to scenario one, as the gap between the global top 1% share and the global bottom 50% share in 2050 widens. In this scenario, the global top 1% would earn close to 28% of global income by 2050, while the bottom 50% would earn close to 6%, less than in 1980, before emerging countries started to catch up with the industrialized world. In this scenario, the increase in the top 1% income share (a positive change of eight percentage points over the 2016–2050 period) is largely, but not entirely, made at the expense of the bottom 50% (a negative change of four percentage points).
Scenario three presents a more equitable global future. It shows that global inequality can be reduced if all countries align on the EU inequality trajectory—or more equitable ones. In this scenario, the bottom 50% income share rises from 10% to approximately 13% in 2050, whereas the top 1% decreases from 21% to 19% of total income. The gap between the shares held by the two groups would, however, remain large (at about six percentage points). This suggests that, although following the European pathway in the future is a much better option than the business-as-usual or the US pathway, even more equitable growth trajectories will be needed for the global bottom 50% share to catch up with the top 1%. Achieving a world in which the top 1% and bottom 50% groups capture the same share of global income would mean getting to a point where the top 1% individuals earn on average fifty times more than those in the bottom half. Whatever the scenarios followed, global inequalities will remain substantial.
Within country inequality trends are critical for global poverty eradication
What do these different scenarios mean in terms of actual income levels, and particularly for bottom groups? It is informative to focus on the dynamics of income shares held by different groups, and how they converge or diverge over time. But ultimately, it can be argued that what matters for individuals—and in particular those at the bottom of the social ladder—is their absolute income level. We stress again here that our projections do not pretend to predict how the future will be, but rather aim to inform on how it could be, under a set of simple assumptions.
Figure 5.1.2 depicts the evolution of average global income levels and the average income of the bottom half of the global population in the three scenarios described above. The evolution of global average income does not depend on the three scenarios. This is straightforward to understand: in each of the scenarios, countries (and hence the world as a whole) experience the same total income and demographic growth. It is only the matter of how this growth is distributed within countries that changes across scenarios. Let us reiterate that our assumptions are quite optimistic for low-income countries, so it is indeed possible that global average income would actually be slightly lower in the future than in the figures presented. In particular, the global bottom 50% average income would be even lower.
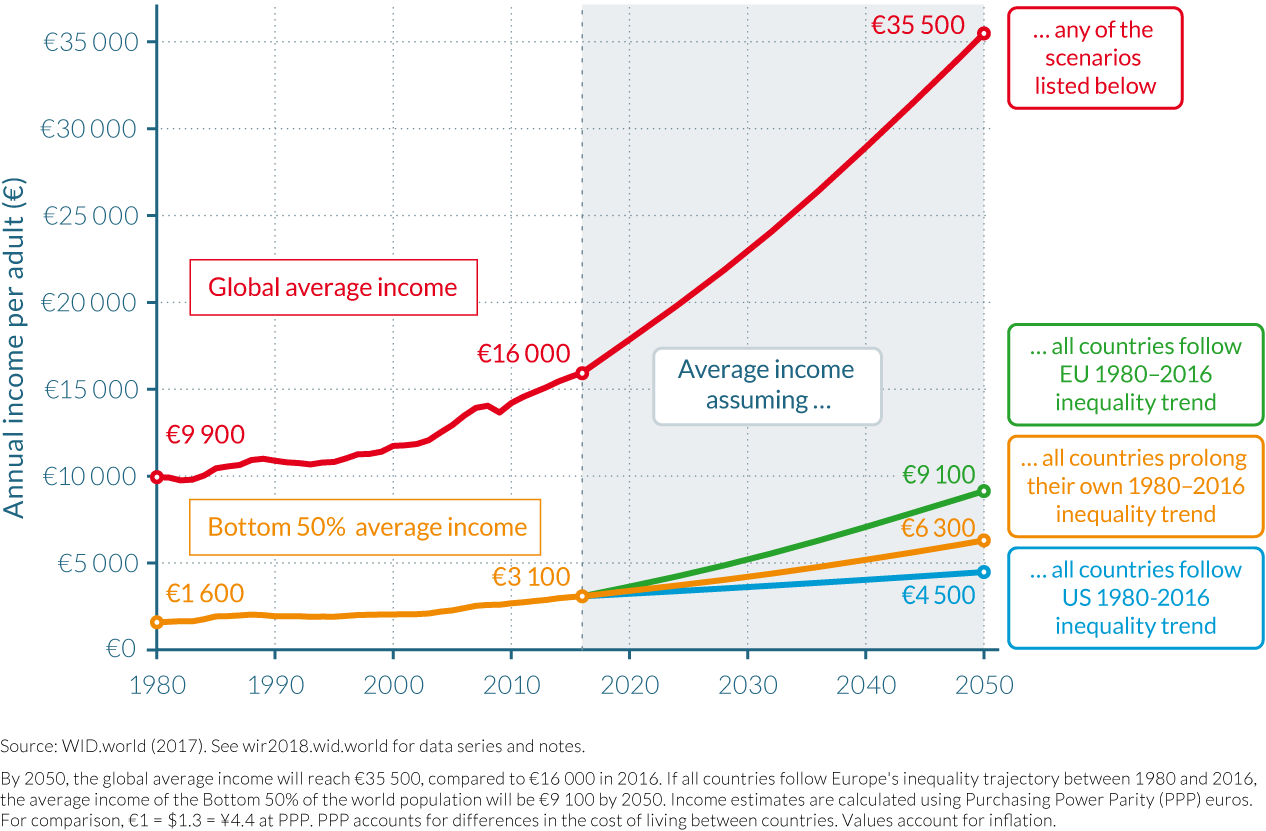
In 2016, the average per-adult annual income of the poorest half of the world population was €3 100, in contrast to the €16 000 global average—a ratio of 5.2 between the overall average and the bottom-half average. In 2050, global average income will be €35 500 according to our projections. In the business-as-usual scenario, the gap between average income and the bottom would widen (from a ratio of 5.2 to a ratio of 5.6) as the bottom half would have an income of €6 300. In the US scenario, the bottom half of the world population earn €4 500 per year and per adult—rising the global average income to bottom 50% income ratio of 7.9. Average income of the global bottom half will be €9 100 in the EU scenario, reducing the bottom 50% to average income ratio to 3.9.
The gap between global average income and the average income of the bottom half of the population is particularly high in all scenarios. However, the difference in average income of the bottom 50% between the EU scenario and the US scenario is important, as well. Average income of the global bottom 50% would be more than twice higher in the EU scenario than in the US scenario at €9 100 versus €4 500. This suggests that within-country inequality trajectories matter—and matter substantially—for poverty eradication. In other words, pursuing high-growth strategies in emerging countries is not merely sufficient to lift the global bottom half out of poverty. Reducing inequality within countries is also key.
The scenarios point toward another crucial insight: global inequality is not bound to rise in the future. Our analysis (in Part II) of the different income inequality trajectories followed by countries showed that, if anything, more equitable growth does not mean dampened growth. This result is apparent when time periods are compared (the United States experienced higher growth in the 1950s–1960s when inequality was at its lowest) or when countries are compared with one another (over the past decades, China grew much faster than India, with a lower level of inequality, and the EU had a more equitable path than the United States but a relatively similar growth rate). This suggests that it is possible to pursue equitable development pathways in a way that does not also limit total growth in the future.
What can governments do to prevent the rise of national and global inequality? The next and final chapters of this report discuss various policy options which need to be democratically debated, on the basis of sound and transparent economic data, if societies are to seriously address the issues raised by rising levels of income and wealth concentration. We do not attempt to resolve any of these policy debates, and nor do we claim to have the right answer as to which set of policies will be best suited to a given country given its own economic, political, social, and cultural situation. Recent research, however, points to fundamental economic issues that have not been discussed enough over the past decades. These include the role of progressive taxation and global financial transparency to tackle rising inequality at the top of the distribution, as well as more equal access to education and good paying jobs to put an end to the stagnation of incomes at the bottom. Reassessing the role of public capital to invest in the future should also, in our view, be a key component of these future discussions.
5.2 Tackling rising inequality at the top: the role of progressive taxation
- There has been a rise global top shares, but different countries have experienced widely different inequality trajectories. Institutional and policy changes implemented since the 1980 stand as the most powerful explanations for the different inequality trajectories.
- Income tax progressivity is a proven tool to combat rising income and wealth inequality at the top. Tax progressivity does not only reduce post-tax inequality; it also impacts pre-tax inequality, by discouraging top earners to capture a higher share of growth via aggressive bargaining for higher pay.
- Tax progressivity was sharply reduced in rich countries from the 1970s to the mid-2000s. During this period, the top marginal income tax rate in rich countries was brought from 70% to 42% on average. Since the global financial crisis of 2008, the downward trend has been halted and reversed in certain countries. Future evolutions remain, however, uncertain.
- Progressive taxation of wealth and inheritances is also a key component of redistribution. In some of the most unequal nations of the world (Brazil, South Africa, India, Russia, and the Middle East), inheritance tax is almost inexistent while the poor often face high tax rates on the basic goods they purchase.
More generally, tax systems are highly regressive in large emerging countries. Evidence from recent inequality trends (for example, Brazil between 2000 and 2015) suggests that progressive tax reform should be given a higher priority in the future.
The previous chapters of this report confirm that income and wealth inequality largely increased at the top of the distribution. The rise in inequality has been driven by the substantial growth rates enjoyed by the very top groups as compared to the rest of the distribution. A common explanation for this growth is skill-biased technological change. That is, the evolution of technology is said to have increased the relative productivity—and hence the relative pay—of skilled labor relative to unskilled labor, thereby increasing the demand for skilled workers. Globalization could have had a similar impact in developed countries as discussed in chapter 2.1. As we have already repeatedly stressed, there are many limitations to this purely technological explanation. First, rising income inequality is a broad-ranging phenomenon which also involves capital income and wealth dynamics, and not only the distribution of labor income. The supply of skilled labor is determined by education. That is, the expansion of education leads to a rise in the supply of skills, while globalization and technological may change increase the demand for skills. Depending on which process occurs faster, the inequality of labor income will either fall or rise. This idea has been described as the race between education and technology.4 In other words, different policies can make a large difference.
Another complementary explanation for rising top labor incomes is the “superstar effect.”5 According to this theory, technological change and globalization have made it easier for those who make it to the top to reap a higher share of growth. For instance, recording a song has more or less the same cost today as thirty years ago, but a successful music production can now reach a much broader audience. Because international firms have become larger, managers making it to the top control a much larger business than before, and their pay has increased as a result.6 Due to the superstar effect, tiny differences in talent—or sometimes in bargaining power and other attributes—can translate into very large income differentials. It should be noted that these global “superstars” are not necessarily more productive or talented than they were thirty years ago. They are perhaps simply luckier to have been born a few decades after their elders.
In any case, the problem behind these two theories—education and superstar—is that they cannot fully account for cross-country divergences in top income trajectories. In a comparison of top remunerations in global firms, it stands out that there are important variations across countries—in particular, between the United States, Europe, and Japan. Germany’s largest companies, for instance, are present in all global markets and are not less productive than their US counterparts, though CEO remunerations there are on average half as high as in the United States.7 As discussed in chapter 2.3, the rise of labor income inequality was relatively limited in Europe compared to the United States, despite similar technical change and penetration of new technologies over the past forty years in both regions.
For the bottom and middle parts of the distribution, the importance of training and education designed to help individuals adapt to new modes of production cannot be overlooked. Unequal access to education is likely to have played a role in the stagnation of incomes of the bottom half of the distribution in recent decades—in particular, in the United States. These dynamics are discussed in the next chapter. They should, however, be distinguished from rising inequalities at the very top of the income distribution. Changes in policy and institutional contexts better account for the diversity of top income trajectories over the world. In particular, recent research shows that changes in tax progressivity have played an important role in the surge of top incomes over the past decades.
Top marginal tax rates have strong effects on both pre- and post-tax income inequality at the top
Progressive tax rates contribute to the reduction of post-tax income inequality at the top of the distribution via their highest marginal tax rates (that is, tax rates applicable above a certain level of income earned). Indeed, if an individual earns $2 million and if the top marginal tax rate is 50% above one million dollars, this individual will net out only $500 000 on the second million. If the top marginal tax rate is 80% above one million dollars, then the earner will net out only $200 000 on the second million. The reduction of inequality can be further enhanced if the public spending funded by this tax revenue is aimed at fostering equitable growth.
One often-neglected role of top marginal tax rates is their ability to reduce pre-tax income inequality. This can occur via two channels. The most obvious one is that when top marginal income tax rates are high, top earners have less money to save and accumulate wealth, and therefore potentially less income from capital next year. Another way to understand the impact on top income tax rates on income inequality is to focus on rich individuals’ bargaining incentives. When top marginal tax rates are low, top earners have high incentives to bargain for compensation increases—for instance, by putting a lot of energy into nominating the right people to the compensation committees who decide on pay packages. Alternatively, high top marginal tax rates tend to discourage such bargaining efforts.8 Reductions in top tax rates can thus drive upwards not only post-tax income inequality but pre-tax inequality, as well.
Higher top tax rates may, however, also discourage work effort and business creation among the most talented. In this scenario, higher top tax rates would lead to less economic activity by the rich and hence less economic growth. In this case, top tax rates are not a desirable policy. In principle, there should be room to discuss these conflicting and legitimate claims on the basis of dispassionate analyses and sound data.
Piketty, Saez, and Stantcheva (2014) have developed a theoretical model and an empirical framework taking into account these different effects.9 By using a database on CEO compensation and performance in developed countries, they conclude that bargaining elasticities are an important part of the story—in particular, to understand the high rise of US CEOs’ pay relative to their counterparts in Japan and Europe (with comparability established by shared corporate sector, firm size, and performance levels). By calibrating the theoretical model, they show top tax rates could rise up to 80% and be welfare-enhancing for everyone apart from the very top of the distribution.
The data at our disposal is still imperfect, and we certainly do not pretend that a mixture of econometric evidence and mathematical formula should replace public deliberation and political decision making on these complex issues. But at the very least, we feel that there is enough evidence to reopen this discussion about sharply progressive taxation at the very top.
It is also important to remember that top tax rates reached more than 90% in the United States and in the UK in the era of the 1940s to the 1970s. Such high tax rates do not appear to have harmed growth. In fact, over the past fifty years, all rich countries have grown more or less at the same rates despite very large tax-policy variations.
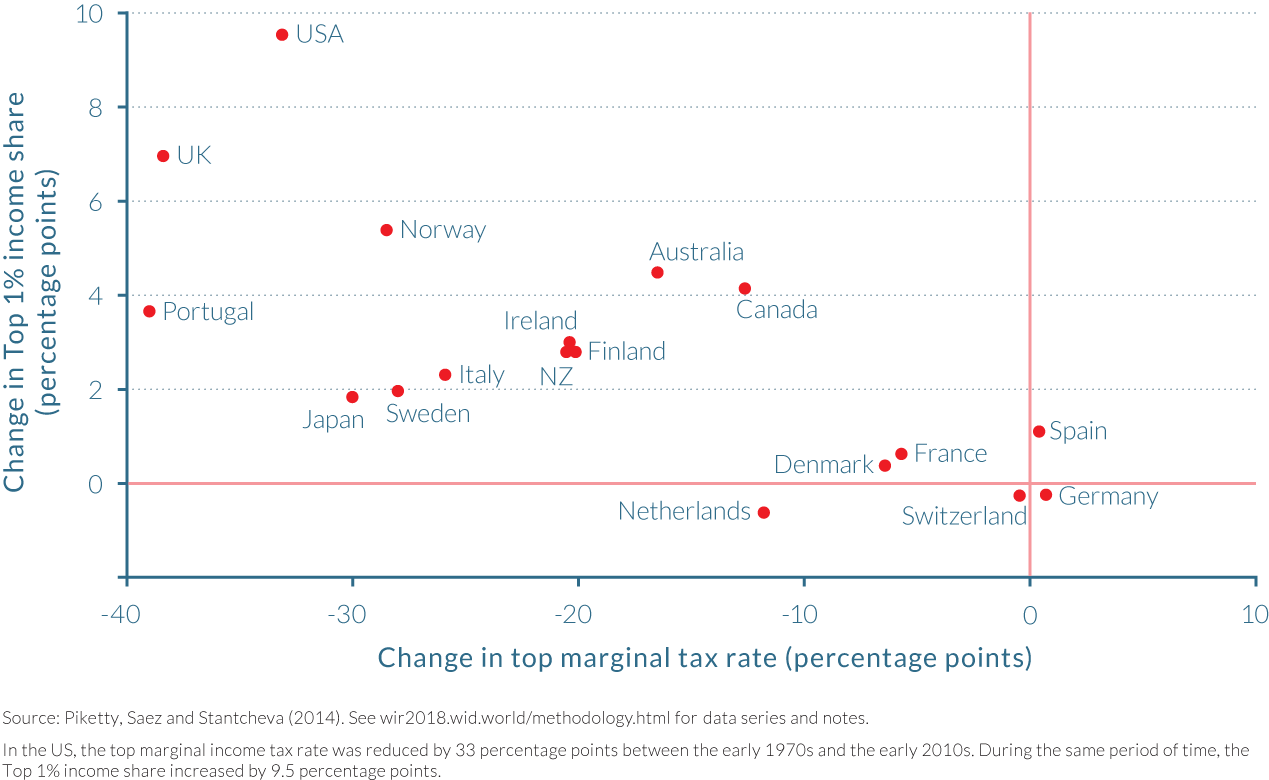
Figure 5.2.1 shows the relationship between changes in top marginal tax rates and in the top 1% pre-tax income share in OECD countries, which occurred between the early 1970s and the late 2000s. The correlation is particularly strong: on average, a 2 percentage point drop in the top marginal tax rate is associated with a 1 percentage point increase in the top 1% pre-tax income share. Countries such as Germany, Spain, Denmark, and Switzerland, which did not experience any significant top rate tax cut, did not experience increases in top income shares. Conversely, the United States, UK, and Canada experienced important reductions in top marginal tax rates and saw their top 1% income shares substantially increase. This graph strongly suggests that top tax rates play a key role in moderating pre-tax top incomes. In addition, there was no significant impact on growth, suggesting again that bargaining elasticities are more important than incentive effects.
A window of opportunity for tax progressivity?
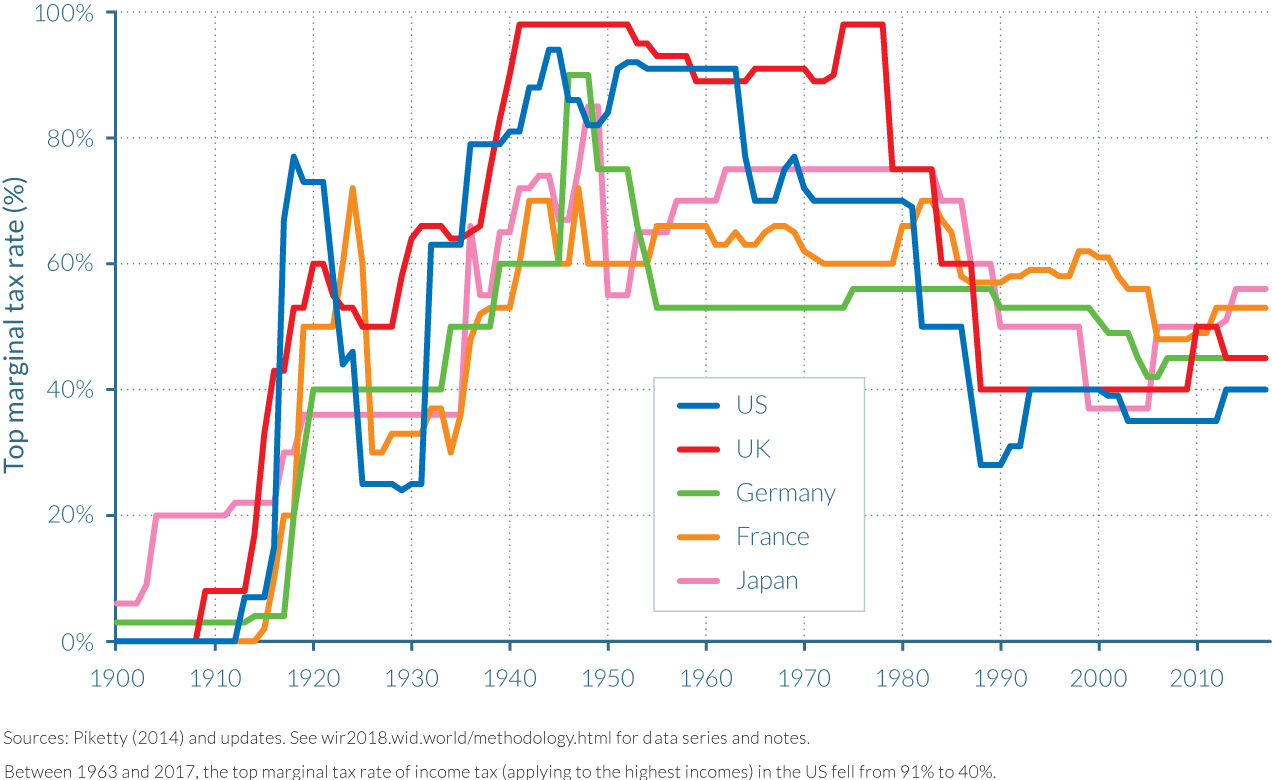
Figure 5.2.2 presents in detail the evolution of top marginal income tax rates in the United States, the UK, Germany, France, and Japan since 1900. In the five countries, there was either no personal income taxation or there was a very modest of it at the turn of the twentieth century. Income tax was then introduced, partly to finance the First World War, and top marginal tax rates were brought to very high levels in the 1950–1970s. (Top tax rates rose up to 94% in the United States, 98% in the UK.) Top rates were then drastically reduced from the 1970s onwards (from 70% on average in these countries to 42% on average in the mid-2000s).
How to account for these movements? Up until the 1970s, policymakers and public opinion probably considered—rightly or wrongly—that at the very top of the income ladder, compensation increases reflected mostly greed or other socially wasteful activities rather than productive work effort. This is why the United States and UK were able to set marginal tax rates as high as 80%. More recently, the Reagan/Thatcher revolution succeeded in making such top tax rate levels unthinkable, at least for a while. But after decades of increasing income concentration that has brought about mediocre growth since the 1970s, and a Great Recession triggered by financial sector excesses, a rethinking of the Reagan and Thatcher policies is perhaps underway—at least in some countries.
Top marginal income tax increased in the United States, UK, Germany, France, and Japan over the past ten years. The United Kingdom, for instance, increased its top income tax rate from 40% to 50% in 2010 in part to curb top pay excesses. In the United States, the Occupy Wall Street movement and its famous “We are the 99%” slogan also reflected the view that the top 1% gained too much at the expense of the 99%. Whether this marked the beginning of a new tax policy cycle that will counterbalance the steep fall observed since the 1970s remains a question. In the UK, the 2010 increase in top income tax rate was followed by slight reduction down to 45% in 2013. As we are writing these lines, the new US Republican administration and congress are preparing a major tax overhaul plan. The French government also projects to reduce tax rates on top incomes and wealth owners.
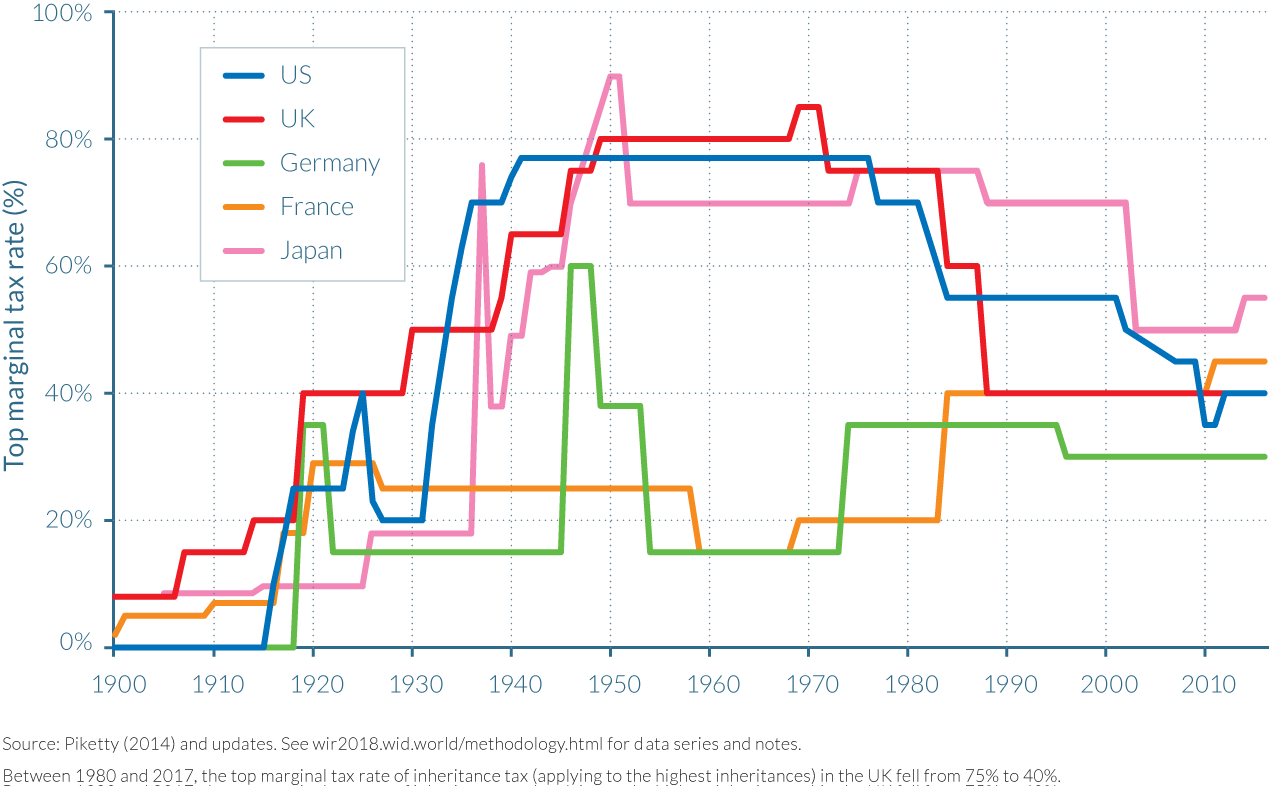
Top inheritance tax rates were recently increased in France, Japan, and the United States, as shown on Figure 5.2.3. In Japan and in the United States, this increase halted a progressive reduction in top inheritance tax rates initiated in the 1980s. In France and Germany, top inheritance tax rates have been historically lower than in the United States, UK, and Japan. In earlier chapters of this report we described the two world wars and various economic and political shocks of the twentieth century.10 These durably reduced wealth concentration through other means than tax policy. As with the question of income tax progressivity, it is impossible to know whether this increase marks a new era of progressivity. The US tax overhaul plan plans to abolish the inheritance tax.
Inheritance is exempted from tax while the poor face high consumption taxes in emerging countries
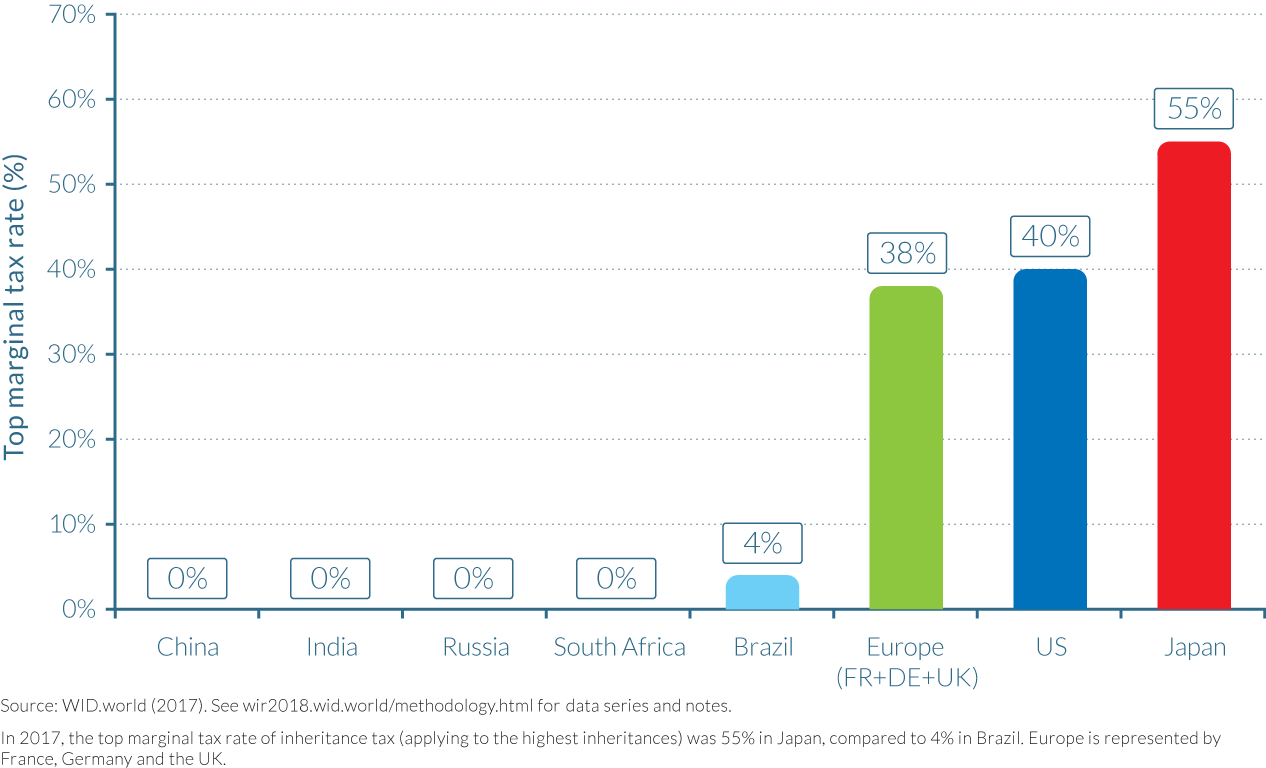
While the past ten years saw some increases in tax progressivity in rich countries, it is worth noting that major emerging economies still do not have any tax on inheritance, despite the extreme levels of inequality observed there. Inheritance is taxed at a particularly small rate in Brazil (at a national average of around 4%, with a maximum federal rate of 8%). In India, China, and Russia, there is no inheritance tax—in contrast to rich countries (see Figure 5.2.4). In India, an 85% tax rate was in place in the 1970s and early 1980s before it was brought to 0% in 1984. One can plausibly argue that India’s tax administration—or even Indian society as a whole—was not ready for very high top inheritance tax rates to begin with. But international evidence—in particular, from developed countries—suggests that a fairly progressive income and inheritance tax system can be an important component of a successful development strategy.
In emerging countries, it is also noteworthy that consumption taxes can be particularly high while inheritance tax is inexistent. In Brazil, for instance, the tax rate on electricity is around 30%, and high rates also apply to many other basic goods purchased by the poor. Extreme income and wealth inequality levels are thus sustained and reinforced by a regressive tax system. On a more positive note, the absence of inheritance taxes in emerging countries suggests that there is ample room for progressive tax policies. In a country like Brazil, as shown in chapter 2.11, incomes at the bottom rose over the past decades, but that this was partly to the detriment of the middle class, whose share of national income was reduced. This situation is bound to happen when the richest do not contribute fairly to the financing of the welfare state. Indeed, additional fiscal revenues collected through newly introduced progressive inheritance taxes could be used to fund educational or health programs and provide relief for the middle class in Brazil and other emerging countries.
5.3 Tax policy in a global environment: the case for a global financial register
- Although the tax system is a crucial tool to tackle inequality, it also faces potential obstacles, among which is tax evasion. The wealth currently held in tax havens is equivalent to more than 10% of global GDP and has increased considerably since the 1970s.
- The rise of tax havens makes it difficult to properly measure and tax wealth and capital income in a globalized world. Reducing financial opacity is critical to improve data on wealth and its distribution; to foster a more informed public debate about redistribution; and to fight tax evasion, money laundering, and the financing of terrorism.
One key challenge involves recording the ownership of financial assets. While land and real-estate registries have existed for centuries, they miss a large fraction of the wealth held by households today, as wealth increasingly takes the form of financial securities. A global financial register recording the ownership of equities, bonds, and other financial assets would deal a severe blow to financial opacity. - Little-known financial institutions called central security depositories (CSDs) already gather information about who owns financial assets. These data could be mobilized to create a global financial register. CSDs, however, are private actors in most OECD countries and will not transfer information to authorities in the absence of regulations compelling them to do so.
- Another difficulty lies in the fact that most CSDs do not directly record the names of the ultimate owners of financial securities, but only the names of the intermediaries.
- However, technical solutions have been identified by the CSDs themselves to allow end-investor identification. Moreover, more transparent systems exist in countries like Norway and China, which suggest that end-user transparency is technically and economically feasible at the CSD and at the global level.
Multinational corporations and wealthy individuals are increasingly using tax havens to avoid or evade taxes. Fully 63% of all the foreign profits made by US multinationals are booked in a handful of offshore financial centers—Bermuda, Ireland, the Netherlands, Switzerland, Singapore, and Luxembourg—where they face very low tax rates, ranging from 0% to 5%. This represents a tenfold increase since the 1980s.
Assets worth the equivalent of 10% of world GDP are stored in tax havens by wealthy individuals. This figure rises to almost 40% in countries like Greece and Argentina, and to more than 50% in Russia, according to novel research by A. Alstadsæter, N. Johannesen, and G. Zucman.11 At the global level, tax evasion deprives governments from about €350 billion in tax revenue each year.12
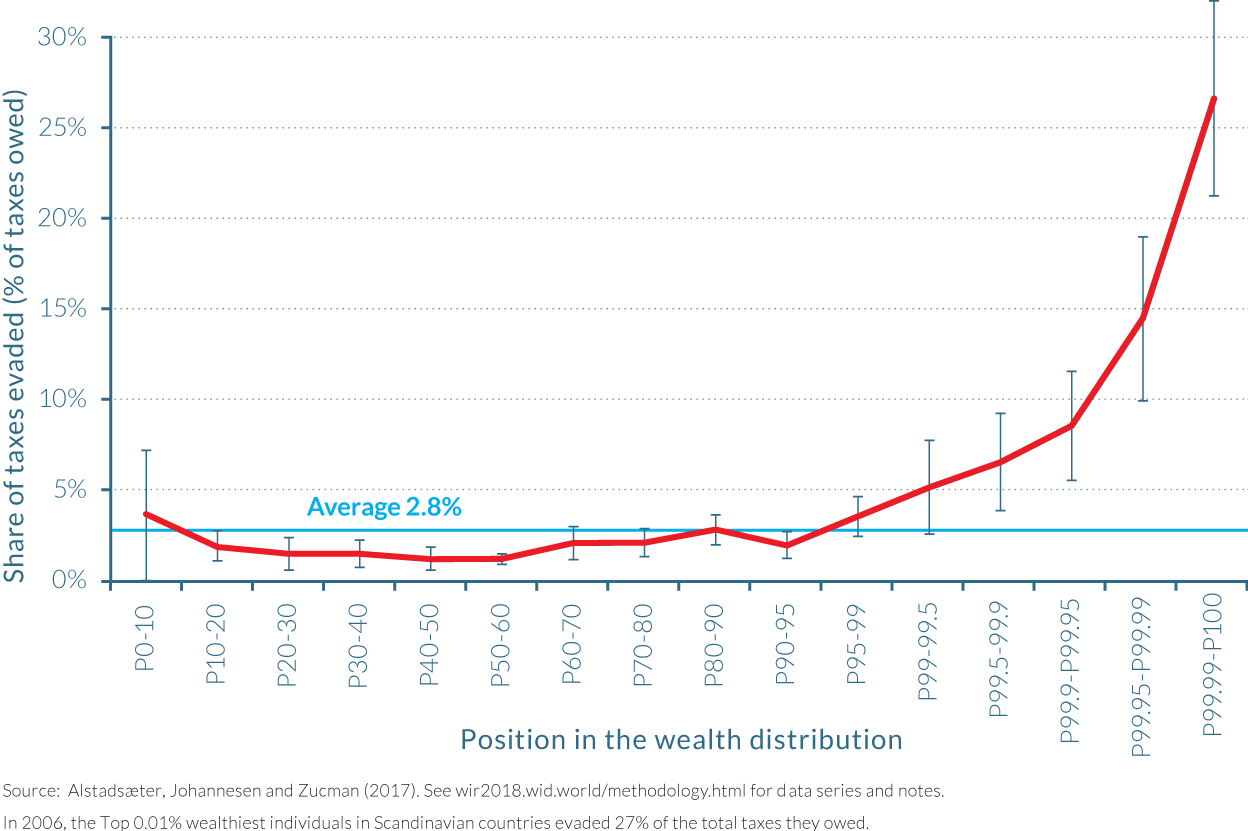
Tax evasion also seriously undermines tax progressivity. Figure 5.3.1 shows the amount of taxes evaded as a share of taxes owed across the wealth distribution, in the case of Scandinavia. These statistics were produced by Alstadsæter, Johannesen, and Zucman (2017), who combine recent, massive data leaks (the “Panama papers” and the Swiss Leaks from HSBC Switzerland) with random audits and administrative records on income and wealth. While most of the population in advanced economies does not evade much tax—because most of its income derives from wages and pensions, which are automatically reported to the tax authorities—leaked data show pervasive tax evasion at the very top. The top 0.01% of the Scandinavian wealth distribution—a group that includes households with more than $45 million in net wealth—evades 25% to 30% of its personal taxes, an order of magnitude more than the average evasion rate of about 3%. Because Scandinavian countries rank among the countries with the highest social trust, lowest corruption, and strongest respect for the rule of law, that evasion among the wealthy may be even higher elsewhere.
Several recent policy initiatives have attempted to tackle offshore tax evasion. Before 2008, tax havens refused to share any information with foreign tax authorities. In 2010, the US Congress enacted the Foreign Account Tax Compliance Act, which compels foreign banks to disclose accounts held by US taxpayers to the IRS automatically each year, under the threat of economic sanctions. OECD countries have obtained similar commitments from most of the world’s tax havens. Apparently, tax havens can be forced to cooperate if threatened with large enough penalties.
However, current enforcement efforts face important obstacles. Many tax havens and offshore financial institutions do not have incentives to provide accurate information, as they do not face large enough sanctions for non- or poor compliance. Second, a large and growing fraction of offshore wealth is held through intertwined shell companies, trusts, and foundations, which disconnect assets from their actual owners. This makes it easy for offshore banks to claim, falsely, that they do not have any European, American, or Asian clients at all—while in fact such persons are the beneficial owners of the assets held through shell companies.
As advocated by Gabriel Zucman in recent work, a global financial register would be a powerful tool for cutting through this opacity.13 Such a register would allow tax and regulatory agencies to check that taxpayers properly report assets and capital income independently of whatever information offshore financial institutions are willing to provide. It would also allow governments to close corporate tax loopholes by enforcing a fair distribution of tax revenue globally for corporations with increasingly complex overseas operations. A global financial register could also serve as the informational basis for the establishment of a global wealth tax. The establishment of such a register would not, however, mean that ownership of assets would be disclosed to the general public. Such information could remain confidential in the same way that current income tax data is kept confidential.
The establishment of a global financial register could be based on the information already gathered by (mostly private) financial institutions known as central securities depositories (CSD). CSDs are the ultimate bookkeepers of the equities and bonds issued by corporations and governments. They can maintain accounts as end-investor segregated accounts—which is the most transparent model, as it links an individual to an asset. Or they can maintain omnibus accounts—a less transparent model, given that assets held by different investors are lumped into a single account under the name of a financial intermediary, making it difficult to identify end-investors. (See Box 5.3.1.)
This box draws upon Delphine Nougayrède, “Towards a Global Financial Register? Account Segregation in Central Securities Depositories and the Challenge of Transparent Securities Ownership in Advanced Economies,” a working paper presented at a Columbia Law School Blue Sky workshop, April 2017.
Central Security Depositories as building blocks for a global financial register
In the modern financial system, shares and bonds issued by corporations are represented not by paper certificates but by electronic account entries. Holding chains are no longer direct—that is, do not connect issuers directly with investors, but involve many intermediaries often located in different countries. At the top of the chain, immediately after the issuers, are the central securities depositories (CSDs). Their role is to record the ownership of financial securities and sometimes to handle the settlement of transactions. The clients of CSDs are domestic financial institutions in the issuer country, foreign financial institutions, and other CSDs. After the CSD participants are several other layers of financial intermediaries, and at the end of the chain, a final intermediary, often a bank, holding the relationship with the investors.
Because so many intermediaries are involved, the issuers of financial securities are disconnected from end-investors; public companies that issue securities no longer know who their shareholders or bondholders are. CSDs, as a part of the chain of financial intermediation, both enable and obscure this relationship. The system was not intentionally designed for anonymity but it evolved this way over time because of the regulatory complexity of cross-border securities trading. The evolution toward non-transparency was also facilitated by the fact that the topic is too technical to be affected by public opinion.
Non-transparent accounts prevail in most Western CSDs
There are two broad types of accounts in the CSD world. “Segregated accounts” allow the holding of securities in distinct accounts opened in the name of the individual end-investors. This model thus allows transparency. The opposite model is that of “omnibus accounts” (or in the United States, “street name registration”) where securities belonging to several investors are pooled together into one account under the name of a single account-holder, usually a financial intermediary, thereby obscuring the identity of the end-investors.
One of the key issues for a global financial register is that non-transparent accounting (that is, “omnibus accounts”) prevails in most Western markets. For instance, the US CSD, the Depository Trust Company (DTC), uses omnibus accounts. In its books, the DTC identifies only brokerage firms and other intermediaries, not the ultimate owners of US stocks and bonds. “Omnibus accounts” also prevail in most European countries—in particular, within the Euroclear and Clearstream CSDs. This makes it difficult to construct a global financial register on the basis of the currently existing Western CSDs.
More transparency is possible, however
More transparency within Western CSDs can however be envisioned. The current system creates a number of risks for the financial industry, of which it is very aware. In 2014, Luxembourg’s Clearstream Banking agreed to a $152 million settlement with the US Treasury following allegations that it had held $2.8 billion in US securities through an omnibus account for the benefit of the Central Bank of Iran, which was subject to US sanctions. As a result, the securities industry discussed a number of options that could be put in place to allow greater transparency of information on end-investors. This might include discontinuing the use of omnibus accounts, introducing new covering message standards (as is done in the payments industry) or ex-post audit trails, which would enable information on the identity of the ultimate beneficiary of financial transactions to circulate throughout the chain. New technologies such as distributed ledger technology (blockchain) could also foster greater transparency.
Transparent market infrastructures already exist today. In Norway, the CSD lists all individual shareholders in domestic companies, acts as formal corporate registrar, and reports back directly to the tax authorities. In China, the China Securities Depository Clearing Corporation Limited (“Chinaclear”) operates a system that is fully transparent for shares issued by Chinese companies and held by domestic Chinese investors. At the end of 2015, it held $8 trillion worth of securities in custody, broadly the range of the CSDs of France, Germany, and the UK, and maintained securities accounts for ninety-nine million end-investors. Some segregation functionalities already exist within some of the larger Western CSDs (like DTC or Euroclear), which could be expanded. Many believe that segregated CSD accounting would support better corporate governance by giving greater voice to small investors. All of this suggests that more could be done within the large Western CSDs to implement greater investor transparency.
One key issue with using CSDs as the building brick of a global financial register is that omnibus accounts prevail in most large western markets. (The Depository Trust Company in the United States and Clearstream in Europe, for instance, operate with omnibus accounts.) However, technical solutions facilitated by developments in information technologies already exist to allow the identification of ultimate asset holders in large Western CSDs. Moreover, in certain countries such as Norway, or large emerging markets such as China and South Africa, CSDs operate through systems which allow the identification of ultimate asset owners. In short, the creation of a global financial register does not face any insuperable technical problems. (See Box 5.3.1.)
5.4 Tackling inequality at the bottom: the need for more equal access to education and good paying jobs
- More equal access to education and good paying jobs is key to countering the stagnation and sluggish income growth rates of the bottom half of the population. Recent research shows that there can be enormous gaps between the beliefs evinced in public discourses about equal opportunity and the realities of unequal access to education.
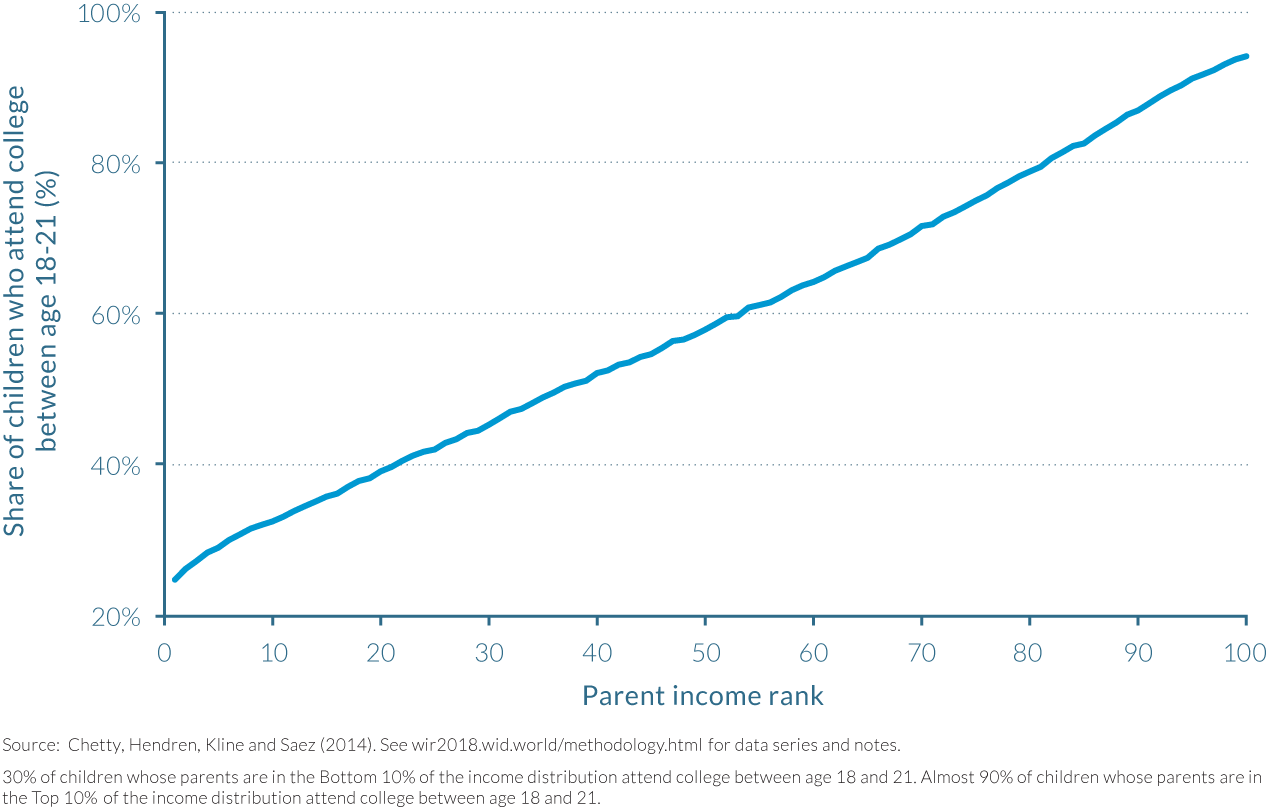
- In the United States, for instance, out of one hundred children whose parents are among the bottom 10% income earners, only thirty go to college. The figure reaches ninety when parents are within the top 10% earners.
- On the positive side, research shows that elite colleges in the United States may improve openness to students from poor backgrounds without compromising their outcomes.
- In rich or emerging countries, it might be necessary to set transparent and verifiable objectives—together with changes in the financing and admission systems—in order to equalize access to education.
As is now well known that inequality has risen at the top of income and wealth distributions in recent decades. However, this report also sheds light on the stagnation or sluggish growth rates of the bottom 90%, and especially of the bottom 50% of the distribution. The situation has been particularly extreme in the United States, as shown in Chapter 2.4. To a lesser extent, bottom income groups have also lagged behind the rest of the population in terms of income growth in European countries as well as in fast-growth emerging countries. To counter such dynamics, progressive income and wealth taxes are not sufficient. More equal access to education and good paying jobs is key. This chapter explores recent findings on the interaction between educational inequalities and income inequalities.
Novel research allows us to better understand the determinants of educational inequalities and their interactions with income inequality
To what extent are income and wage inequality the result of a fair, meritocratic process? How do family resources determine the opportunities of their children? Publicly available data to assess these questions is still scarce in most countries around the globe. But recent research has contributed to answering the question. In particular, using US administrative data on more than fifty million children and their parents, Raj Chetty, Nathaniel Hendren, Patrick Kline, Emmanuel Saez, and Nicholas Turner were able to provide remarkable results on intergenerational mobility.14
Intergenerational mobility, broadly speaking, refers to the link between children’s economic trajectories and their parents’ economic situations. In the United States, estimations show that mobility levels are low as compared to other countries: fewer than eight American children out of a hundred born in the 20% poorest families manage to get to the top 20% of earners as adults, as compared to twelve in Denmark and more than thirteen in Canada. Another powerful way to illustrate the extent of educational inequality in the United States is to focus on the percentage of children attending college by income groups. Out of a hundred children whose parents are within the bottom 10% income earners, only thirty go to college. The figure reaches ninety when parents are within the top 10% earners.
The findings displayed by Figure 5.4.1 show that there is sometimes an enormous gap between official discourses about equal opportunity, meritocracy, and so forth and the reality of unequal access to education. This also suggests that it might be necessary to set transparent and verifiable objectives—together with changes in the financing and admission systems—in order to equalize access to education.
In the United States, intergenerational mobility is also a local issue
In the case of the United States, strong geographic inequalities also interact with educational inequalities. In geographical areas with the highest mobility, a child born in a family from the bottom 20% of the income distribution has a 10% to 12% chance of reaching the top 20% as an adult (that is about as much as in the highly mobile countries of Canada or Denmark). Examples of highly mobile places include the San Francisco Bay and Salt Lake City in Utah. In areas with low intergenerational mobility, a child born in a family from the bottom 20% of the income distribution has only a 4% to 5% chance of reaching the top 20% as an adult. No advanced economy for which we have data has such low rates of intergenerational mobility. Cities in the US south (such as Atlanta) or the US rust belt (such as Indianapolis and Cincinnati) typically have such low mobility rates.
What factors best explain these geographical differences in mobility? Detailed analysis shows that race and segregation play an important role in the United States. In general, intergenerational mobility is lower in areas with larger African-American populations. However, in areas with large African-American populations, both blacks and whites have lower rates of upward income mobility, indicating that social and environmental causes other than race, such as differences in history and institutions, may play a role. Spatial and social segregation is also negatively associated with upward mobility. In particular, longer commuting time decreases opportunities to climb the social ladder, and spatial segregation of the poorest individuals has a stronger negative impact on mobility. This suggests that the isolation of lower-income families and the difficulties they experience in reaching job sites are important drivers of social immobility.
Income inequality at the local level, school quality, social capital, and family structure are also important factors. Higher income inequality among the poorest 99% of individuals is associated with lower mobility.15 Meanwhile, a larger middle class stimulates upwards mobility.16 Higher public school expenditures per student along with lower class sizes significantly increase social mobility. Higher social capital also favors mobility (for example, areas with high involvement in community organizations).17 Finally, family structure is also a key determinant; upward mobility is substantially lower in areas where the fraction of children living in single-parent households, or the share of divorced parents, or the share of non-married adults is higher.
What is remarkable is that combining these factors explains very effectively social mobility patterns. Taken together, five factors—commuting time, income inequality among the 99% poorest individuals, high-school dropout rates, social capital, and the fraction of children with single parents—explain 76% of inequalities in upward mobility across local areas in the United States. The vast geographic disparities in mobility in the United States, and the fact that they can be best explained by a combination of social factors at the commuting zone level, show that intergenerational mobility is largely a local issue.
Access to quality higher education is particularly unequal in the United States
The link between school quality and upward mobility that was highlighted above suggests that educational policies, school organization, and access rules can play a key role in promoting intergenerational mobility. Raj Chetty, John Friedman, Emmanuel Saez, Nicholas Turner, and Danny Yagan recently characterized intergenerational mobility in US colleges over a period of nearly fifteen years, from 1999 to 2013.18 They show the extent of inequality in access to higher education, but also reveal tremendous scope for improvement: if all institutions could be made as efficient as the highest 10% colleges in terms of social mobility, then mobility in the United States would be perfect. Children’s outcomes would be unrelated to their parents’.
Intergenerational mobility at the level of a given college may be defined as bringing together two components: the access rate and the success rate. Access rate refers to the openness of that college to students from lower-income groups, and can be measured as the proportion of students in it who come from the poorest 20% families. Success rate refers to that college’s ability to help children from poor backgrounds reach higher income groups throughout their life. It might, for instance, be evaluated as the share of students ending up in the top 20% income group, given that they come from families in the bottom 20% of the national income distribution. Putting these together, one might define the mobility rate as the fraction of all students in a given college who come from the poorest 20% families and end up in the top 20% group. Theoretically, the mobility rate of a perfectly mobile society would be 4%.19 The fact that it is currently just 1.7% in the United States as a whole shows that there is room for substantial improvement in providing low-income children with fair opportunities.
It is important to note, nevertheless, that family income differences only weakly predict the income positions of children from the same college. We saw that, at the national level, parental income strongly determined future position in the income distribution. However, within a given college, the relationship between parental income and student income is five times lower. At the national US level, children from the top 20% income groups end up 30 percentiles higher in the distribution than those from the bottom 20%; but among students attending a given elite college, this gap shrinks to close to 7 percentiles on average.
Contribution to mobility varies greatly across US colleges
Access to elite colleges remains highly unequal in the United States. Approximately 3% of children at Harvard University born between 1980 and 1982 come from the bottom 20% poorest families, whereas 70% come from the top 10%. In Ivy-Plus colleges (the most selective colleges in the United States) in general, there are more students coming from the top 1% richest families (14.5%) than from the bottom half (13.5%) of the population.
Such figures contrast sharply with public colleges. At Glendale Community College in Los Angeles, for instance, 32% of students come from the bottom quintile and only 14% from the top quintile. What is interesting is that high access rate colleges can also have high success rates (outcomes similar to highly selective colleges), translating into high mobility rates. Colleges helping many low-income students to reach the top of the income distribution tend to be public colleges welcoming a large number of low-income students. The existence of such institutions is particularly meaningful as it indicates that elite colleges may improve openness to students from poor backgrounds without compromising their outcomes.
Trends in mobility are heterogeneous, but show that little progress has been made overall
How did access and success rates evolve in the past decade in the United States? The data allow us to track their evolution between 2000 and 2011. During this period, the fraction of low-income college students increased from 10.6% to 12.8%, and this growth has been concentrated at for-profit institutions and two-year colleges. Access rates increased by only 0.65 percentage points among the most selective colleges, even though most Ivy-Plus colleges implemented tuition reductions and other policies to welcome more students from disadvantaged backgrounds. This does not mean that these policies were inefficient. Given the context of rising inequality in the United States, mobility may have worsened without them. All that is visible is that the net combination of these factors left access to elite colleges mostly unchanged.
Differences in mobility rates show that improving poor children’s access to high-performing schools could substantially improve the contribution of education to upward mobility. Given that children from low-income families have similar success rates than their peers of a given college, opening them access to good colleges can hardly be considered as misplacement. Until now, efforts to expand access has mostly focused on elite colleges. Considering changes in admissions criteria may be an important way forward. Improving access and increasing funding to high-mobility-rate colleges may also be critical. These colleges have very good outcomes, admit a large number of low-income students, and operate at relatively low cost compared to elite colleges.
Educational inequalities can also be important in countries with lower levels of income and wealth inequality
European countries experienced a smaller rise of income and wealth inequality than that observed in the United States in recent decades (see Parts II–IV). This certainly does not mean, however, that the issue of education inequality is not relevant in Europe. In particular, France is one of the most unequal OECD countries in terms of educational inequality, as highlighted by the 2015 Programme for International Student Assessment (PISA). While the PISA survey provides information on France’s general performance in terms of educational inequalities, still very little is known about the local characteristics explaining the large differences in outcomes between students from low- and high-income backgrounds. Gabrielle Fack, Julien Grenet, and Asma Benhenda have made significant contributions in this respect; their findings based on new data on middle schools and high schools in the Parisian region illustrate a particularly extreme case of educational inequality, but also are encouraging as they reveal how public policies can address these issues.20
As their work shows, in 2015, 115 public middle schools and 60 private schools welcomed more than 85 000 students, many of whom came from higher socio-professional groups (49%) and few from disadvantaged backgrounds (16%). Overall, Parisian middle schools appear to be extremely segregated, with the share of students from lower socio-professional groups ranging from 0.3% to 63% in middle schools of the capital. Private schools play a key role in social segregation by concentrating wealthier families: most private schools in Paris included less than 10% of students from low-income groups, and the private school with the highest level of social diversity welcomed only 25%. Therefore, it appears that private schools succeed in crowding out less-advantaged students and contribute directly to the polarization of the French educational system.
Social segregation is closely related to spatial segregation
This polarization is reinforced by territorial segregation. Paris is strongly divided into distinct areas—the north, northeast, east, and south, where median yearly income levels are below €30 000, and the center and west, where they are usually above €40 000. At the same time, access to Parisian middle schools is determined by location in the city. The French system allocates students in restricted geographical areas according to a “school map” (carte scolaire), which implies that a student living at a given address can in principle access only one public middle school. Unsurprisingly, the repartition of students coming from poor and rich backgrounds therefore closely resembles that of parental income: certain middle schools in the relatively modest areas of Paris have more than 50% of students from low-income families, while most of schools in the richest areas of the city have less than 10%.
Spatial segregation, however, goes far beyond these geographical areas, and also exists at a very narrow level within Parisian districts (arrondissements). In the eighteenth district, for instance, the share of students coming from poor backgrounds ranges from 9% to 58%, among high schools that are just a few hundred meters apart from one another. This effect is also reinforced by private schools, as wealthy families have the option to escape the public middle-school system.
Transparent data is a necessary condition to improve public debates on education
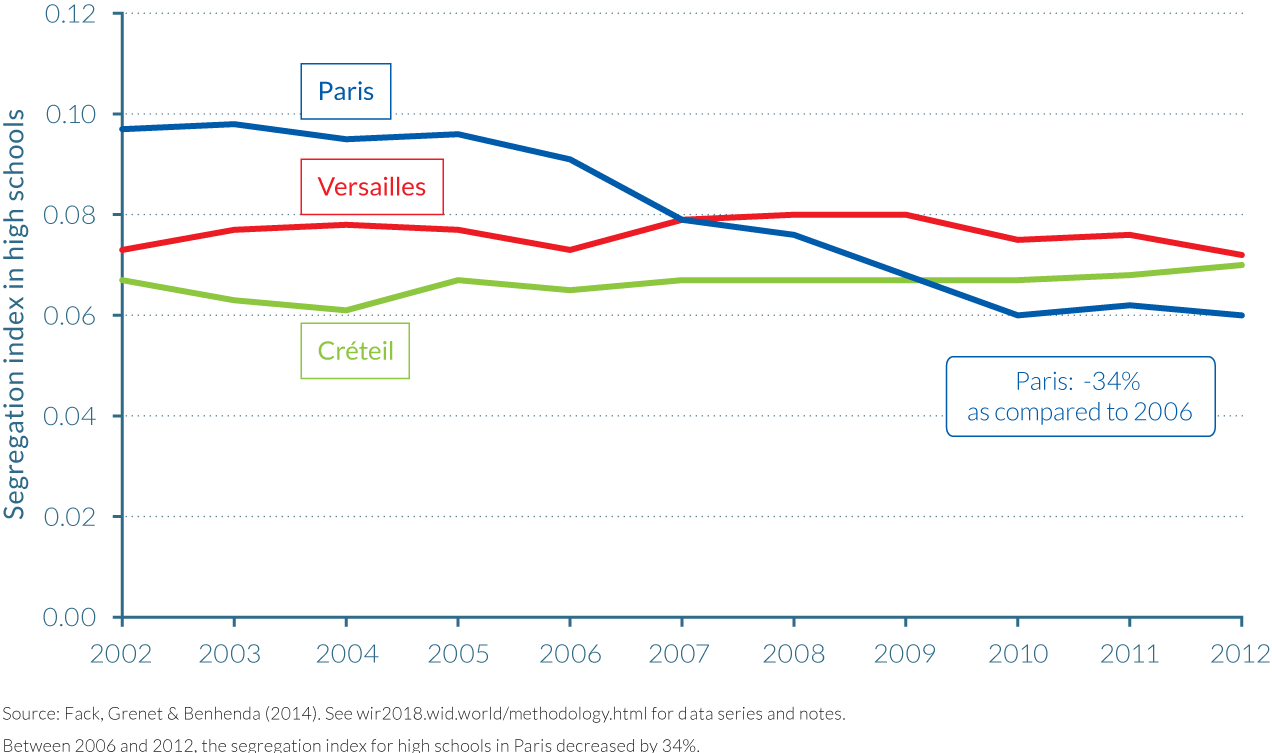
Tracking the evolution of educational segregation is fundamental to understanding why France displays such extreme disparities in students from low- versus high-income groups—and it is of crucial importance to evaluate existing policies. Concerning middle schools, segregation has been much higher in Paris than in Versailles or Créteil (both neighboring towns, all managed under different administrative units) since 2002, and has remained relatively stable in the three cities.
However, new evidence from the evolution of segregation in high schools shows a very different picture. In 2007–2008, Paris implemented a new system of student allocation to high schools. Contrary to neighboring towns of Versailles and Créteil, where geographic proximity remained decisive, Paris decided to allocate students to their schools on the basis of their grades, across areas larger than before, to encourage social mixing. Students coming from disadvantaged backgrounds also obtained bonus points and therefore had more flexibility in the choice of their high schools.
Social segregation in public high schools in Paris decreased by one-third between 2002 and 2012 (see Figure 5.4.2), so that Paris has achieved a rate lower than in both Versailles and Créteil since 2010. The analysis of the new high-school allocation system based on students’ grades shows that it played an important part in this evolution. Between 2005 and 2012, the share of students with grants based on social criteria, studying in the top 25% Parisian high schools, nearly doubled—from 12% to 21%, while this share remained stable in the neighboring cities, as well as in Parisian middle schools which did not implement the allocation procedure.
This evaluation shows that reducing social segregation is possible. Evaluating and designing new allocation systems is therefore of crucial importance to giving equal opportunities to all children regardless of their socioeconomic origin. In this respect, citizens can engage in a transparent, democratic debate informed by reliable information. Indeed, this issue is not limited to rich countries. Emerging countries such as India are also confronted with large educational inequalities. Some have for a long time established reservation systems based on quotas. These are complex and far from perfect, but the study of their strengths and limits can help others countries make progresses (see Box 5.4.1).
In order to tackle extreme social inequalities, India developed a vast system of preferential admission to the universities (as well as in public sector employment) for children from the lowest castes (the SC/ST or “Scheduled Castes/Scheduled Tribes,” the former highly discriminated untouchables, or almost 30% of the population). This nationwide program started in the 1950s. The implementation of reservation policies based on social and cultural segregation, however, faces complex measurement and political challenges. What is the correct way to identify legitimate beneficiaries? How can a dynamic reservation system be designed, which takes into account demographic, cultural, and economic changes?
In India, the so-called “reservation policies” aroused growing frustration amongst the children in the intermediate castes (the OBC, or “Other Backward Classes,” roughly 40% of the population) caught between the most disadvantaged groups and the highest castes. Since the 1980s, several Indian states extended the policy of preferential admission to these new groups (including the Muslims who were excluded from the original system). Conflicts concerning these arrangements are all the greater because the old boundaries between castes are porous and do not always match the hierarchies in income and wealth. Far from it, in fact. In 2011, the federal government finally resolved to clarify these complex relationships by organizing a socio-economic census of the castes (the first to be carried out since 1931). The results of this census have been criticized as being unreliable and the central government also agreed on a series of measurement errors.
This reveals the importance of sound and legitimate data production systems to track demographic, economic, and cultural evolutions. In order to bypass current criticisms associated with reservation policies, one option for India could be to gradually transform these preferential admission policies into rules founded on universal social criteria, such as parental income or place of residence, along the lines of the admission mechanisms used for entry to schools or higher education institutions.
To a large extent, it could be argued that a country like India is simply endeavoring to confront the challenge of effective equality with the means available to a state based on the rule of law, in a situation where inequality of status originating in the former society and past discrimination is particularly extreme and threatens to degenerate into violent tensions at any time. However, as we have seen above, rich countries are not exempt from these issues, either—as may sometimes be thought. Indeed, rich and poor countries alike have a great deal to learn from the trials and errors of the Indian reservation system, one of the oldest nationwide affirmative action programs in the world.
Indeed, reservation systems cannot be sufficient to ensure equal access to education. If public schools and universities do not have enough resources to pay for good teachers, buildings, and furniture, even the most equalizing allocation system will have little impact on the democratization of quality education. Large public investments in this are essential today, in emerging and rich countries countries alike. In addition, educational policies alone are not sufficient to tackle inequality at the bottom—policies supporting fair wages are also key (see Box 5.4.2).
Educational policies promoting social mobility and equality of opportunity are certainly key to reducing income inequality and widening access to good jobs. They remain, however, limited in their ability to provide decent incomes to all. Policy tools potentially useful for increasing workers’ pay include the minimum wage, and more democratic corporate governance.
It is, in this respect, noteworthy to mention that wage inequality and employment precariousness remain of crucial importance, and have been increasing in a range of countries. According to the International Labour Organization, the share of labor in aggregate income has continued its long-run decline in the past five years, and still, 80% of workers are paid less than the average wage of the firm in which they work—a fact that skills-related characteristics fail dramatically to explain. Whether countries record high rates of average income growth or not, if individuals can only expect a declining share of it, equality-of-opportunity policies in education alone will fall short of meeting their demands.
Minimum wages and labor market regulation can be critical to tackling income inequality.
Figure 5.4.3 illustrates how regulatory policies can be tightly linked to disparities in earnings. While the real minimum wage has been steadily increasing in France since the beginning of the 1970s, in the United States it was actually higher in 1980 than it is today. Differences in income inequality dynamics between the two countries mirror this pattern, especially at the bottom of the distribution, as chapters 2.4 and 2.5 showed. Today, minimum wage workers in France earn nearly €10 per hour, almost 50% more than their counterparts in the United States, and this despite an average national income per adult in the United States that is 50% higher than in France. Minimum wages can therefore usefully help in compressing wage disparities, and notably differences in earnings between men and women, given that women are overrepresented among the low-paid in both developed and developing countries.
To reduce wage inequality and improve the overall quality of jobs would surely require deep changes in the way the power of different stakeholders is determined and organized. Some Nordic and German-speaking countries have already undergone changes in this direction by promoting “codetermination.” For instance, employees’ representatives hold half the seats in executive boards of major German firms, which ensures better consideration of workers’ interests in companies’ strategic choices or decisions over executive or workers’ pay. These examples suggest that while being crucial, educational policies cannot suffice on their own to tackle the extreme inequality levels observed in certain countries.
5.5 A message from the past: let governments invest in the future
- The share of public wealth in national wealth has declined in most countries analyzed in this report. In many rich countries, it is now close to zero (France, Germany, Japan) or even negative (US, UK).
- Such low levels of public wealth makes tackling existing and future inequality extremely challenging given that governments do not currently possess the resources necessary for investments in education, healthcare and environmental protection.
- Selling public assets and/or undergoing prolonged periods of austerity would be barely sufficient, or even insufficient, to repay public debts. Moreover, these policies would leave governments without the means to improve equality of opportunity for their citizens.
- History indicates that there are three different ways – and generally a combination of the three – by which a reduction of large public debts can be achieved: progressive taxes on private capital, debt relief, and inflation. Given the potential difficulties in controlling the incidence and extent of inflation, a combination of the former two policies appears more appropriate.
- Reducing public debt is, however, by no means an easy task. Whilst several options exist and have been used across history, it is challenging to identify the best option(s) for each country. This is a matter for serious public debate, which must be grounded in sound economic, social and historical data and analyses
The share of public wealth in total national wealth has declined in all the countries analyzed in this report (see Part III). In Russia and China, this decline is the logical consequence of the move away from a communist system. Both countries were, however, successful to maintain relatively high levels of public capital as compared to rich countries. The current situation in rich countries stands out as an anomaly from a historical perspective.
During the postwar economic boom, public assets in European countries were considerable (approximately 100–130% of national income, thanks to their very large public sectors, the result of postwar nationalizations), and significantly higher than public debt (which was typically less than 30% of national income). In total, public capital—net of debt—was largely positive, in the range of 70–100% of national income. As a result, net public wealth made up a significant share of total national wealth between 1950 and 1980, typically around 15–25% or more.
Over the past thirty years, public debt approached 100% of national income in most industrialized economies, with the result that net public capital became almost zero. On the eve of the global financial crisis in 2008, it was already negative in Italy. The latest available data, presented in Part IV, shows that net public capital has become negative in the United States, Japan, and the United Kingdom. In France and in Germany, net public capital is just slightly higher than zero.
This situation does not mean that rich countries have become poor: it is their governments which have become poor. As discussed in Part IV, private wealth—net of debt—has risen spectacularly since the 1970s. Private wealth represented 300% of national income back then. Today it has risen to, or exceeded, 600% in most rich countries. This prosperity in private wealth is due to multiple causes: the rise in property prices (agglomeration effects in larger metropolitan areas); the aging of the population and decline in its growth (which automatically increases savings accumulated in the past in relation to current income and contributes to inflating the prices of assets); and the privatization of public assets and rise in debt (which is held in one form or another by private owners, via the banks). Also contributing to this increase were the very high returns obtained by the highest financial assets (which structurally grow faster than the size of the world economy) and the evolution in a legal system globally very favorable to private property owners (both in real estate and in intellectual property).
It is interesting to remark that countries such as China and Russia, despite large shifts in the balance of private and public capital since their transition away from Communism, have succeeded in maintaining relatively high public wealth levels. In China, public wealth is above 200% of national income, and it is close to 100% in Russia. While the ratio has sharply decreased in Russia over the past two decades, it has remained fairly constant in China. In both cases, it is still much higher than in rich countries. Governments in these countries have preserved significant means of action and control over their economies.
Large public property has obviously important consequences for the state’s ability to conduct industrial, educational, or regional development policy (sometimes efficiently and sometimes less so). In contrast, negative public wealth also has potentially enormous fiscal consequences: governments with negative net public wealth typically have to pay large interest payments before they can finance public spending and welfare transfers, while those with large positive net public wealth can potentially benefit from substantial capital income, and finance more public spending than what they levy in taxes. This situation is particularly problematic in a situation of high income and wealth inequality.
What, then, are the different options for highly indebted governments? One possibility would be to sell all public assets (including all public buildings, schools, universities, hospitals, police stations, and infrastructure). In the United States, Japan, and the UK—and even more true of Italy—this would not be sufficient to repay the totality of public debt. In France and Germany, it would barely be sufficient. In all these cases, moreover, states would then have lost all (or nearly all) means of control over their education and health systems. To put it differently, social states would largely disappear, leaving governments without means to ensure equality of opportunity.
Another option would be to undergo prolonged periods of austerity, via drastic reductions in governments’ expenditures. In effect, this also contributes to increasing inequality as governments would slash their redistribution programs to repay debts. In terms of both justice and efficiency, austerity and privatizations stand out as very bad measures.
Fortunately there are also other options. In history, one generally observes three different ways—and generally a combination of the three—to accelerate the reduction of a large public debt: progressive taxes on private capital; debt relief; and inflation.
First, an exceptional tax on private capital can raise substantial revenue to reduce debt. For instance, a flat tax of 15% on private capital in rich countries (about 600% of national income) would yield nearly a year’s worth of national income (exactly 90% of national income) and thus allow for immediate reimbursement of all nearly outstanding public debt.
This solution is equivalent to repudiation of the public debt, except for two crucial differences. First, it is always difficult to predict the ultimate incidence of a debt repudiation (even a partial one). Bondholders are forced to accept what is called a “haircut”—meaning that the value of government bonds held by banks and creditors is reduced by 10–20% or even more. The problem is that it is very difficult to predict which actors ultimately bear the loss and, when applied at a large scale, haircuts can trigger panic among investors and a wave of bankruptcies—and potentially, the meltdown of the financial sector, which few governments are willing to experience. Second, an exceptional tax on private capital, contrary to a debt repudiation, can be adjusted to individuals’ wealth levels—by using an explicitly progressive rate structure. Given the very large concentration of wealth, this is highly preferable. For instance, the top 1% of the wealth distribution typically owns around 30% of total wealth (that is, the equivalent of 180% of national income if aggregate wealth represents 600% of national income). Instead of using a flat tax of 15% on private capital, one could raise the same revenue by exempting the bottom 99% of the wealth distribution and applying an average effective tax rate of 50% on the top 1% wealth group. Alternatively, one could use an intermediate system. For instance, a progressive tax on capital that levied zero tax on capital up to 1 million euros, a 10% tax between 1 and 5 million euros, and a 25% tax above 5 million euros would raise 20% of national income in Europe—and that would be an important step toward a gradual reduction of public debt.
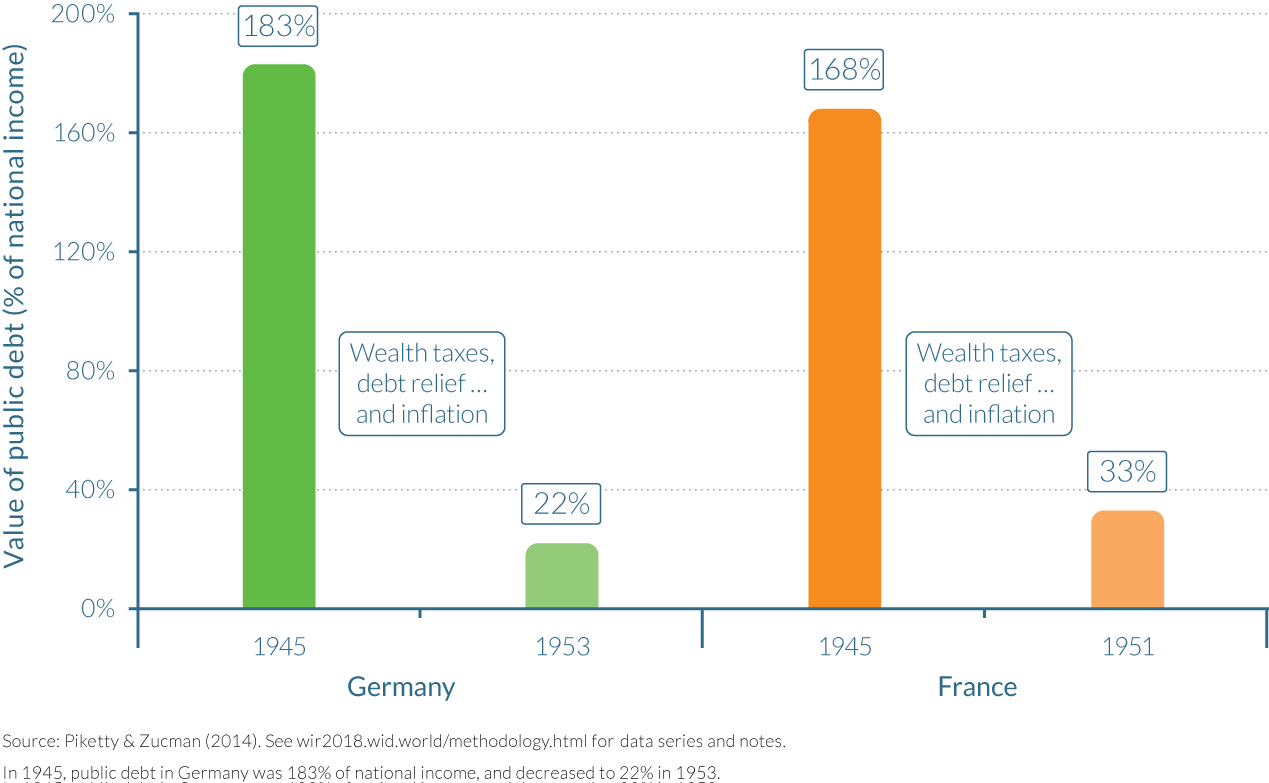
Interestingly, a special tax on capital was applied in France in 1945 to reduce substantial public debt. This special tax had progressive rates which ranged from 0 to 25%. Most importantly, special progressive taxes on private wealth were put in place after the Second World War in Germany, and were gradually paid by German private wealth holders between the 1950s and the 1980s.
At that time, exceptional progressive taxes on private wealth were used together with various gradual forms of debt repudiation and debt relief—an obvious second way to accelerate the reduction of a large public debt. In particular, Germany benefited from a near complete reduction of its foreign debt at the London conference in 1953. These were debts that were accumulated by Germany during the reconstruction period of 1945 to 1953. International creditors—largely governments—decided in 1953 to postpone repayment until German unification (with no indexation mechanism), and the debt was eventually entirely cancelled.21
In the current context, new forms of debt relief might develop in Europe, and to some extent have already started to develop (albeit too slowly, and with multiple hesitations and setbacks). Specifically, public institutions like the European Central Bank (ECB) and the European Stability Mechanism (ESM) could gradually take onto their balance sheets rising fractions of individual countries’ public debts and postpone repayments until certain social, economic, and environmental objectives have been met. This would make it possible to have the advantages of debt repudiation without the financial instability coming from investor panic and bankruptcies.
Finally, the third solution used historically to accelerate the reduction of a large public debt is inflation. Historically, this mechanism played a crucial role in the reduction of most public debts. High levels of inflation were the major mechanisms used in France and Germany to bring their public debts to very low levels after the First World War, and they also played a central role in the aftermath of the Second World War, together with more sophisticated mechanisms like progressive wealth taxes and debt relief. One major problem with inflation as a policy instrument is that it is hard to control. Once it starts, policymakers may have difficulties stopping it. Inflation, moreover, is a much less precise tool than taxation in terms of incidence. In theory, it could act as a tax on those who have idle capital, and provide relief to those who are indebted by reducing the value of their debt. In practice, however, it can have less desirable effects from a fairness point of view. During high-inflation phases, large and well diversified portfolios invested on the stock market can earn a good return while smaller wealth holdings of the middle class and the poor held in savings accounts can be wiped out. A combination of exceptional wealth taxes and debt relief seems like a better option.
Reducing public debt is thus by no means an easy task. Several options exist and have been used across history. We certainly do not pretend that we have identified the best option for each country. This is a matter of serious public debate, which must be grounded in sound economic, social, and historical analysis and comparisons over time and countries. (See Box 5.5.1.) In this discussion, there is one crucial element: today, large investments are required to promote more equal access to education or to protect the environment and combat the consequences of climate change.22 If these challenges go unaddressed they are likely to reinforce tomorrow’s levels of economic inequality. Recent history has shown that in exceptional circumstances, exceptional measures were taken by societies through their governments to reinvest in the future.
The need for sound economic data to allow civil society, researchers, businesses, and policymakers to debate and develop informed and balanced policy responses to rising economic inequality has been a dominant theme in this report.
In that regard, it is interesting to note that the United Nations agreed in 2015 to seventeen sustainable development goals (SDGs), as part of a global agenda to transform society in rich and poor countries alike. Recognizing that rising income and wealth inequality has become a universal issue, SDG Target 10 commits countries to “reduce inequalities within and among countries.” To that end, the SDG framework calls on states to articulate nationally specific implementation strategies and to put in place monitoring and review processes to meet the UN goals.
This development is particularly remarkable since international organizations have until recently paid limited attention to within-country inequality issues, considering the reduction of inequalities to be a sovereign issue for each country, or positing inequalities as a necessary evil towards global improvement of wellbeing. Concerns about domestic income inequalities were politically confined in the shadow of absolute poverty considerations, until the UN’s Sustainable Development Goals replaced its former Millenium Development Goals. In addition, global development goals have so far only focused on poor and emerging countries—leaving rich countries aside. We have seen, however, that both rich and poor countries face rising inequality.
In this context, the unanimous endorsement of SDG Target 10.1 by the UN member states marks an important shift. Target 10.1 aspires to “by 2030, progressively achieve and sustain income growth of the bottom 40 per cent of the population at a rate higher than the national average.” This target was subject to harshly contested debates among country representatives. While China argued that within-country inequality reduction was a national prerogative, the United States contended that a standalone goal on inequality would better be achieved through economic growth. At some point, the inequality target was even removed from the SDG list. A group of countries led by Denmark, Norway, and Brazil supported its reinsertion, arguing that a specific metric should be used to precisely ensure that growth reduces inequality.a If anything, such debates suggest that countries are taking this new indicator seriously.
How do countries fare on SDG Target 10.1? WID.world data is particularly suited to address this question. Table 5.5.1 compares target achievement of six countries over the following periods of time: 2015–2016, 2000–2016, and 1980–2016. The focus here is on pre-tax income.
In 2016–2015, only one country was able to meet the target: France. In all five other countries, the income growth of the bottom 40% was lower than the national average. These results help underscore the power of this objective: it is transformative in the sense that it cannot be automatically met. Countries will have to act if they want to fulfill their commitments. The 2000–2016 period provides another crucial insight. During this time span, Brazil, France, and Russia were able to meet the target—with very different average growth trajectories, however. This implies that success has been possible over relatively longer time spans for several countries, and suggests that meeting the target in the future is not only desirable but also feasible—even if results over the 1980–2016 period are less encouraging.
Two points are worth noting.
First, as described earlier in this report, inequality also increased at the top. Focusing on the bottom 40% alone can miss important dynamics—in part for the middle class, which may be squeezed between increases in both the bottom 40% share and the top 1% share. In particular, the top 1% can also grow significantly faster, as was the case in most countries for the periods considered. In Brazil from 2000 to 2016, the bottom 40% grew much faster (12%) than the average (1%), but the top 1% grew at 24% in the meantime. To a lesser extent, this also occurred in France over 2015–2016, with bottom 40% groups and the top 1% growing faster than average. This means that the income share held by individuals richer than the bottom 40% but poorer than the top 1% decreased. This “squeezed middle class” phenomenon obviously poses one of the most important policy challenges for the years to come and deserves very careful scrutiny.
Second, these estimates focus on pre-tax income. Pre-tax income inequality estimates take into account most cash redistribution in rich countries (see Box 2.4.1) but do not include personal income and wealth taxes. International comparisons of post-tax income inequality measures are thus also necessary to assess the full impact of fiscal policy. As discussed earlier in this report, more work lies ahead to collect, harmonize, and analyze such information. The United Nations and other international organizations have a responsibility in this regard. WID.world will remain committed to working toward such results, with all its statistical contributors willing to dedicate resources to this task, to enlighten the public democratic debate.
Bearing in mind these remarks, the SDG Target 10.1 on inequality stands out as a very useful tool for stakeholders dedicated to tackling economic inequality. To be sure, an inequality metric based on sound data cannot in itself change policy—but it is a necessary basis for doing so. The SDG framework can also lead to the establishment of a framework for collective learning on inequality reduction policies.b As emphasized in this report, there is large scope for learning between rich and poor countries regarding the fiscal, educational, wage, and public investments policies they employ to promote fairer development pathways.
b Chancel et al., “Reducing Inequalities within Countries.”
NOTES
- OECD (2017), GDP long-term forecast. doi: 10.1787/d927bc18-en. Note that the rates we use are voluntarily more optimistic than the rates assumed by the OECD to compute their total global income in 2050 for Africa, Latin America, and Asia. Assuming higher growth rates tends to reduce global inequality. Ours should be seen as a conservative approach to the rise of global inequality in the coming decades.
- UNDESA (2017) UN Population Prospects. https://esa.un.org/unpd/wpp/. Note that we use the medium variant of the UN prospects.
- These projections may be done at the level of regions rather than of countries, when there are not sufficiently detailed data over the 1980–2016 period.
- Goldin, C. D., and Katz, L. F. (2009). The Race between Education and Technology. Harvard University Press.
- “The Economics of Superstars,” American Economic Review, 71 (5): 845–858, 1981.
- Gabaix, X., and Landier, A. (2008). “Why Has CEO Pay Increased So Much?” Quarterly Journal of Economics, 123(1), 49–100. https://doi.org/10.1162/qjec.2008.123.1.49
- Bloomberg (2017). Global CEO Pay Index. Bloomberg database.
- Piketty, T., Saez, E., and Stantcheva, S. (2014). Optimal Taxation of Top Labor Incomes: A Tale of Three Elasticities. American Economic Journal: Economic Policy.
- Piketty, T., Saez, E., and Stantcheva, S. (2014). Ibid.
- See also Piketty, T. (2014). Capital in the Twenty-First Century. Harvard University Press.
- A. Alstadsæter N. Johannesen, and G. Zucman (2017). “Who Owns the Wealth in Tax Havens? Macro Evidence and Implications for Global Inequality,” NBER Working Paper No. 23805.
- Zucman, G. (2015). The Hidden Wealth of Nations: The Scourge of Tax Havens. University of Chicago Press and updates.
- Zucman, Gabriel (2014). Taxing across Borders: Tracking Personal Wealth and Corporate Profits. The Journal of Economic Perspectives, 28(4), 121–148.
- Chetty, R., Hendren, N., Kline, P., Saez, E., and Turner, N. (2014). “Is the United States Still a Land of Opportunity? Recent Trends in Intergenerational Mobility.” The American Economic Review, 104(5), 141–147. And Chetty, R., Hendren, N., Kline, P., and Saez, E. (2014). “Where is the Land of Opportunity? The Geography of Intergenerational Mobility in the United States.” The Quarterly Journal of Economics, 129(4), 1553–1623.
- The raw correlation between upward mobility and the Gini coefficient in commuting zones is -0.58. The top 1% income share, however, is only weakly correlated with mobility (-0.19), so that upward mobility correlates more with inequality when measured by the Gini coefficient computed on the bottom 99% of the income distribution.
- The size of the middle class is measured by the fraction of parents in a community zone who have family incomes between the twenty-fifth and seventy-fifth percentiles in the national income distribution.
- The authors use a social capital index developed by Rupasingha and Goetz (2008) which factors in voter turnout rates, fraction of people returning census forms, and various measures of participation in community organizations.
- Chetty, R., Friedman, J. N., Saez, E., Turner, N., and Yagan, D. (2017). Mobility Report Cards: The Role of Colleges in Intergenerational Mobility (No. w23618). National Bureau of Economic Research.
- Indeed, perfect mobility would mean that there was no link between a family’s income group and its child’s income group. Thus, children coming from the poorest 20% families would be evenly distributed across the five quintiles, so that 4% of them (20% divided by 5) would join the top 20%.
- Fack, G., Grenet, J., and Benhenda, A. (2014). L’impact des procédures de sectorisation et d’affectation sur la mixité sociale et scolaire dans les lycées d’Île-de-France. Rapport de l’Institut des Politiques Publiques, (3).
- See for example A. Ritschl, “Does Germany Owe Greece a Debt? The European Debt Crisis in Historical Perspective”, LSE, 2012.
- See Chancel, L. and Piketty, T. (2015). Carbon and Inequality: From Kyoto to Paris. Trends in the Global Inequality of Carbon emissions (1998–2013) and Prospects for an Equitable Adaptation Fund. Paris School of Economics.