Executive summary
I. What is the aim of the world inequality report 2018?
The World Inequality Report 2018 relies on a cutting-edge methodology to measure income and wealth inequality in a systematic and transparent manner. By developing this report, the World Inequality Lab seeks to fill a democratic gap and to equip various actors of society with the necessary facts to engage in informed public debates on inequality.
- The objective of the World Inequality Report 2018 is to contribute to a more informed global democratic debate on economic inequality by bringing the latest and most complete data to the public discussion.
- Economic inequality is widespread and to some extent inevitable. It is our belief, however, that if rising inequality is not properly monitored and addressed, it can lead to various sorts of political, economic, and social catastrophes.
- Our objective is not to bring everyone into agreement regarding inequality; this will never happen, for the simple reason that no single scientific truth exists about the ideal level of inequality, let alone the most socially desirable mix of policies and institutions to achieve this level. Ultimately, it is up to public deliberation, and political institutions and their processes to make these difficult decisions. But this deliberative process requires more rigorous and transparent information on income and wealth.
- To equip citizens to make such decisions, we also seek to relate macroeconomic phenomenon—such as nationalization and privatization policies, capital accumulation, and the evolution of public debt—to microeconomic trends in inequality focused on individuals’ earnings and government transfers, personal wealth, and debt.
- Reconciling macro and microeconomic inequality data is not a straightforward exercise given that many countries do not publicly release, or may not even produce, detailed and consistent income and wealth inequality statistics. Standard measures of inequality often rely on household surveys, which routinely underestimate the income and wealth of individuals at the top of the social ladder.
- To overcome current limitations, we rely on a groundbreaking methodology which combines in a systematic and transparent manner all data sources at our disposal: national income and wealth accounts (including, when possible, offshore wealth estimates); household income and wealth surveys; fiscal data coming from taxes on income; inheritance and wealth data (when they exist); and wealth rankings.
- The series presented in this report rely on the collective efforts of more than a hundred researchers, covering all continents, who contribute to the WID.world database. All the data are available online on wir2018.wid.world and are fully reproducible, allowing anyone to perform their own analysis and make up their own mind about inequality.
II. What are our new findings on global income inequality?
We show that income inequality has increased in nearly all world regions in recent decades, but at different speeds. The fact that inequality levels are so different among countries, even when countries share similar levels of development, highlights the important roles that national policies and institutions play
in shaping inequality.
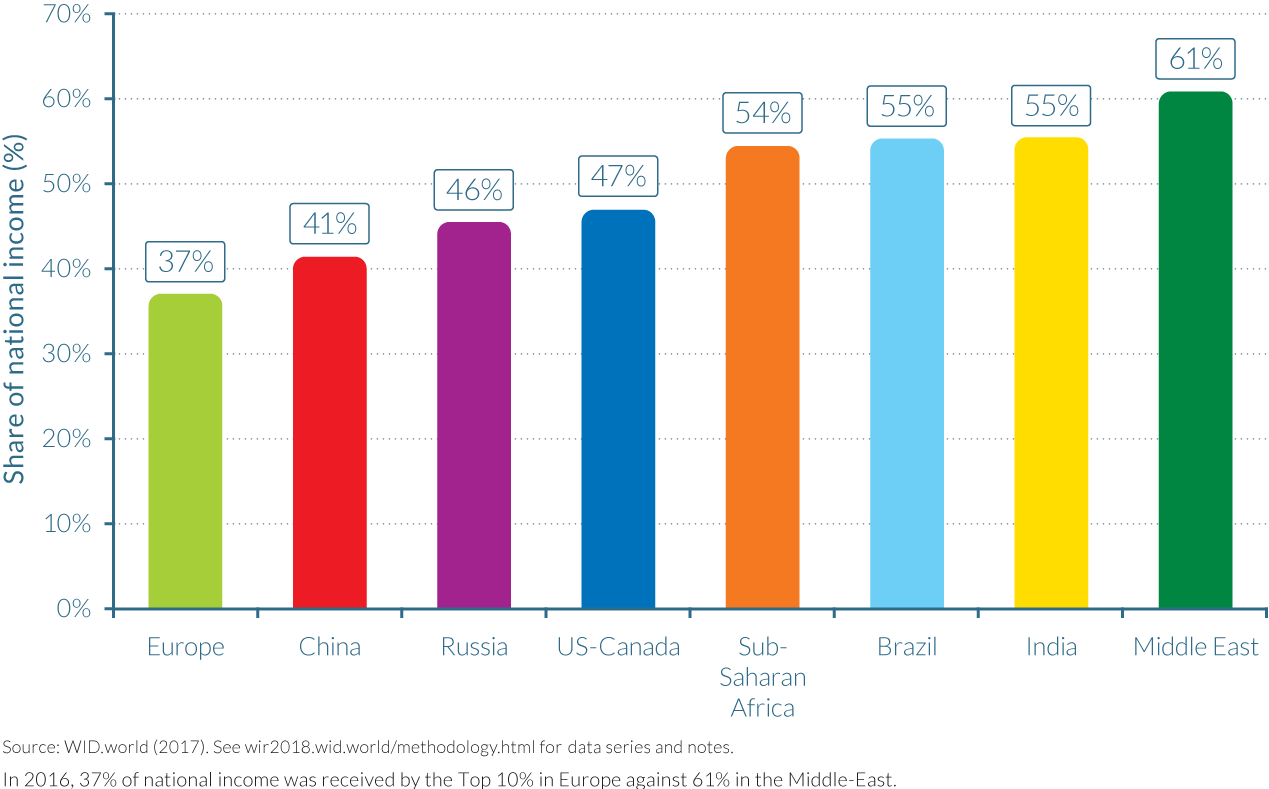
Income inequality varies greatly across world regions. It is lowest in Europe and highest in the Middle East.
- Inequality within world regions varies greatly. In 2016, the share of total national income accounted for by just that nation’s top 10% earners (top 10% income share) was 37% in Europe, 41% in China, 46% in Russia, 47% in US-Canada, and around 55% in sub-Saharan Africa, Brazil, and India. In the Middle East, the world’s most unequal region according to our estimates, the top 10% capture 61% of national income (Figure E1).
In recent decades, income inequality has increased in nearly all countries, but at different speeds, suggesting that institutions and policies matter in shaping inequality.
- Since 1980, income inequality has increased rapidly in North America, China, India, and Russia. Inequality has grown moderately in Europe (Figure E2a). From a broad historical perspective, this increase in inequality marks the end of a postwar egalitarian regime which took different forms in these regions.

- There are exceptions to the general pattern. In the Middle East, sub-Saharan Africa, and Brazil, income inequality has remained relatively stable, at extremely high levels (Figure E2b). Having never gone through the postwar egalitarian regime, these regions set the world “inequality frontier.”
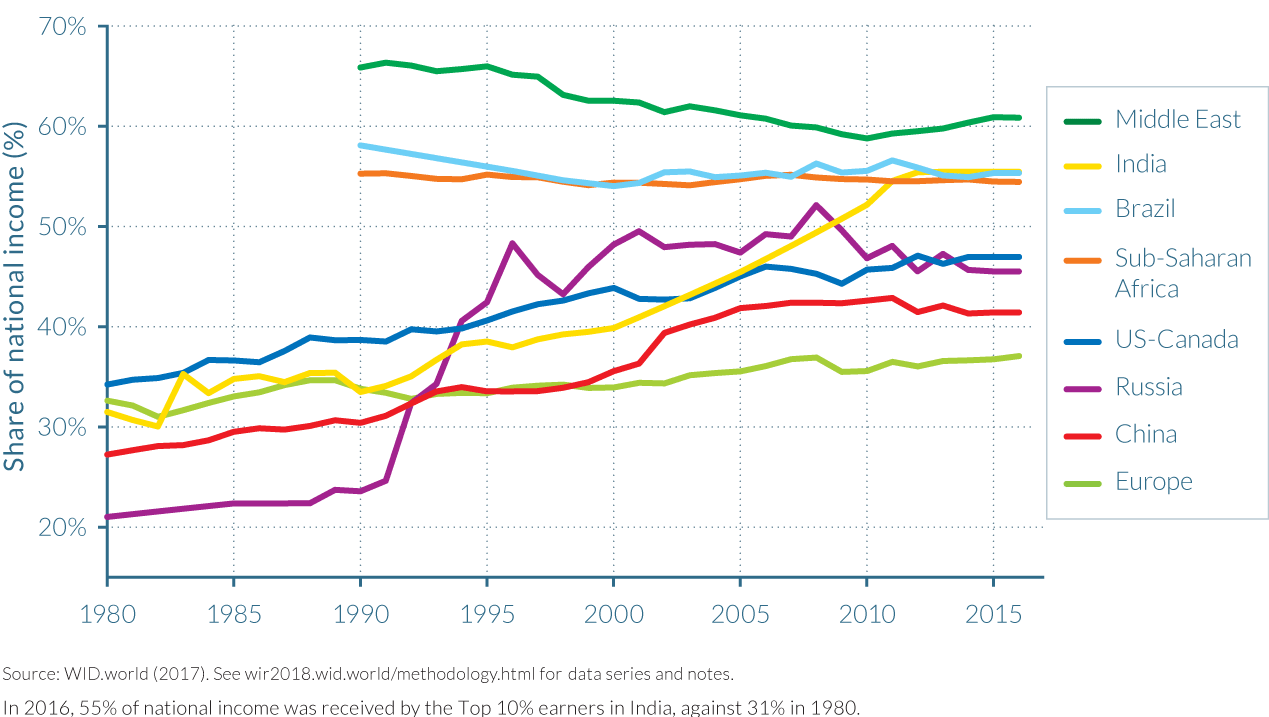
- The diversity of trends observed across countries since 1980 shows that income inequality dynamics are shaped by a variety of national, institutional and political contexts.
- This is illustrated by the different trajectories followed by the former communist or highly regulated countries, China, India, and Russia (Figure E2a and b). The rise in inequality was particularly abrupt in Russia, moderate in China, and relatively gradual in India, reflecting different types of deregulation and opening-up policies pursued over the past decades in these countries.
- The divergence in inequality levels has been particularly extreme between Western Europe and the United States, which had similar levels of inequality in 1980 but today are in radically different situations. While the top 1% income share was close to 10% in both regions in 1980, it rose only slightly to 12% in 2016 in Western Europe while it shot up to 20% in the United States. Meanwhile, in the United States, the bottom 50% income share decreased from more than 20% in 1980 to 13% in 2016 (Figure E3).
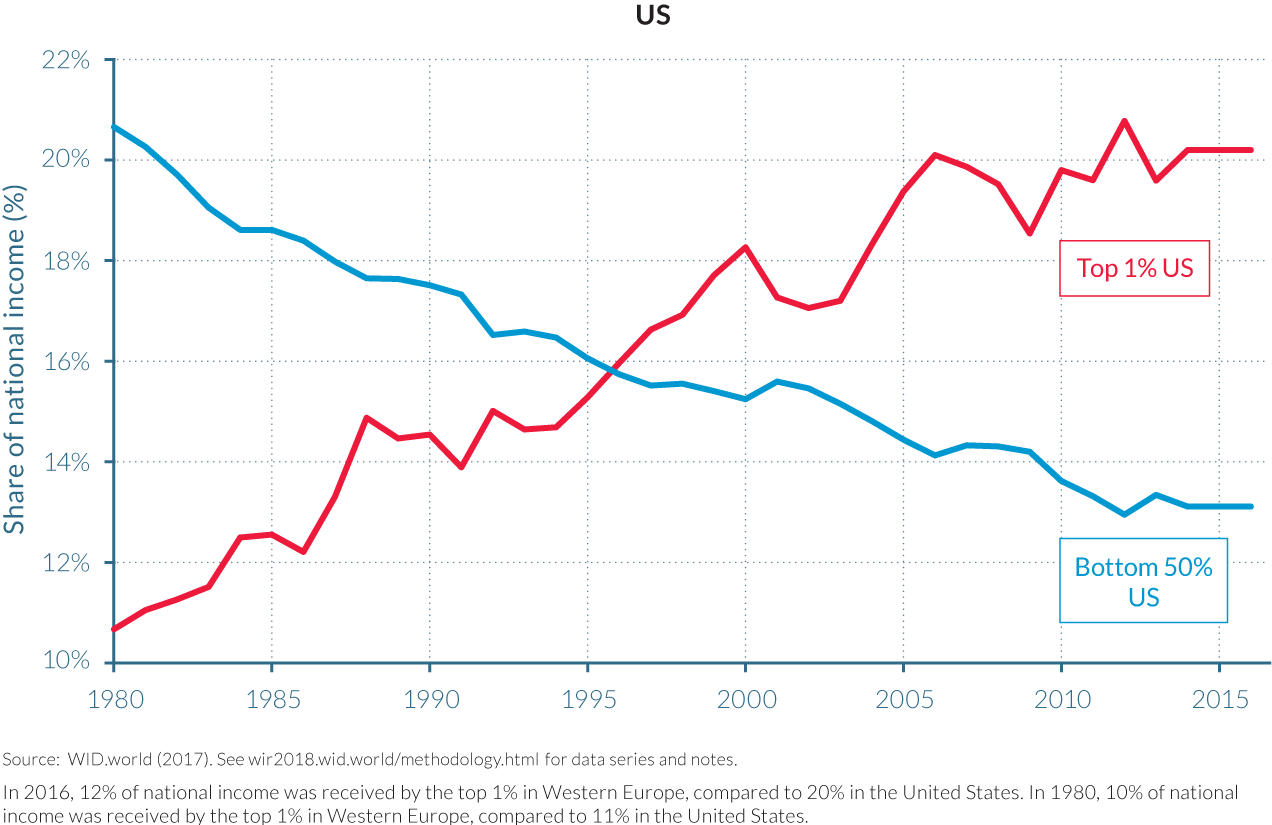
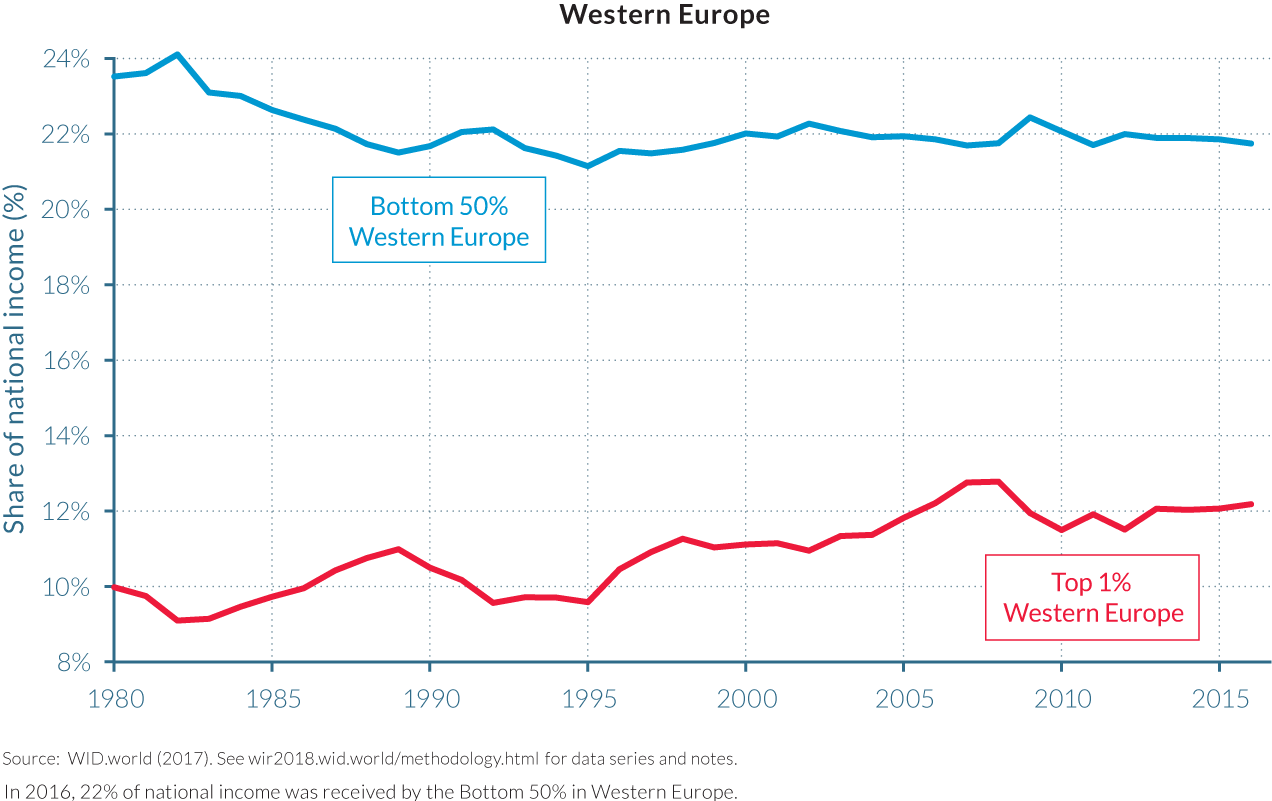
- The income-inequality trajectory observed in the United States is largely due to massive educational inequalities, combined with a tax system that grew less progressive despite a surge in top labor compensation since the 1980s, and in top capital incomes in the 2000s. Continental Europe meanwhile saw a lesser decline in its tax progressivity, while wage inequality was also moderated by educational and wage-setting policies that were relatively more favorable to low- and middle-income groups. In both regions, income inequality between men and women has declined but remains particularly strong at the top of the distribution.
How has inequality evolved in recent decades among global citizens? We provide the first estimates of how the growth in global income since 1980 has been distributed across the totality of the world population. The global top 1% earners has captured twice as much of that growth as the 50% poorest individuals. The bottom 50% has nevertheless enjoyed important growth rates. The global middle class (which contains all of the poorest 90% income groups in the EU and the United States) has been squeezed.
At the global level, inequality has risen sharply since 1980, despite strong growth in China.
- The poorest half of the global population has seen its income grow significantly thanks to high growth in Asia (particularly in China and India). However, because of high and rising inequality within countries, the top 1% richest individuals in the world captured twice as much growth as the bottom 50% individuals since 1980 (Figure E4). Income growth has been sluggish or even zero for individuals with incomes between the global bottom 50% and top 1% groups. This includes all North American and European lower- and middle-income groups.

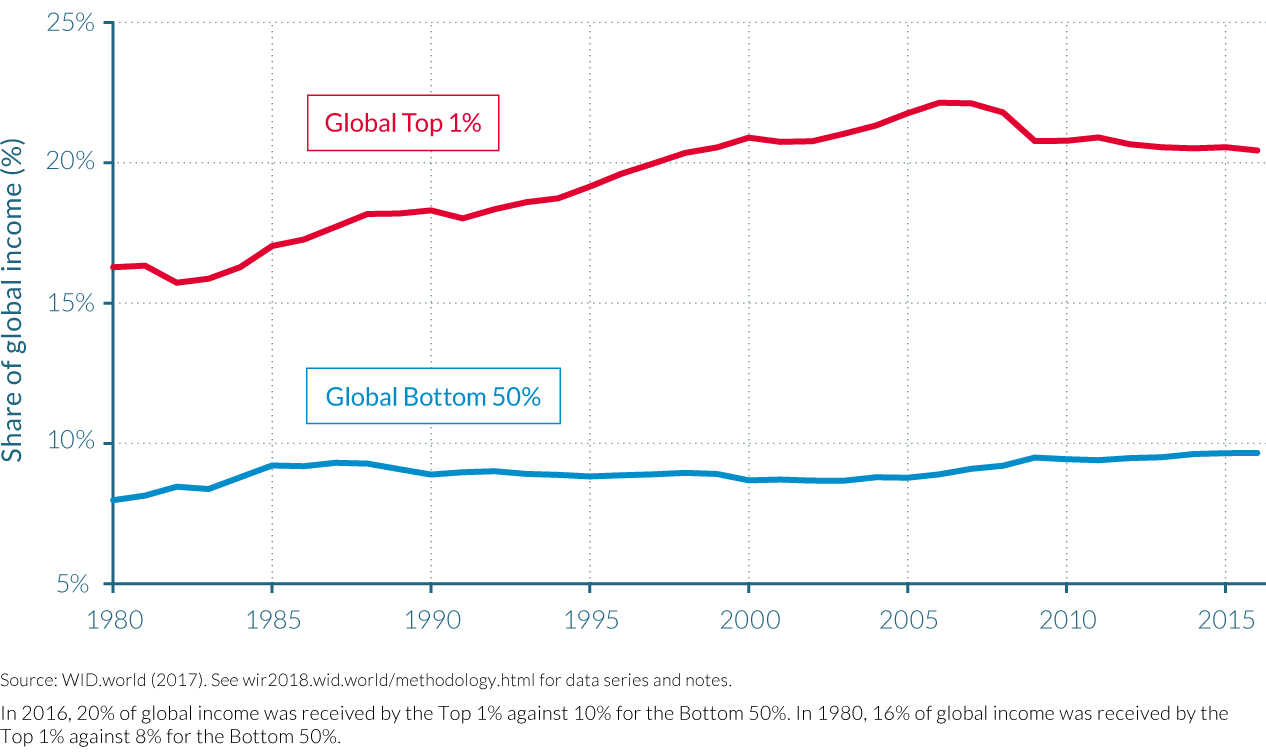
- The rise of global inequality has not been steady. While the global top 1% income share increased from 16% in 1980 to 22% in 2000, it declined slightly thereafter to 20%. The income share of the global bottom 50% has oscillated around 9% since 1980 (Figure E5). The trend break after 2000 is due to a reduction in between-country average income inequality, as within-country inequality has continued to increase.
III. Why does the evolution of private and public capital ownership matter for inequality?
Economic inequality is largely driven by the unequal ownership of capital, which can be either privately or public owned. We show that since 1980, very large transfers of public to private wealth occurred in nearly all countries, whether rich or emerging. While national wealth has substantially increased, public wealth is now negative or close to zero in rich countries. Arguably this limits the ability of governments to tackle inequality; certainly, it has important implications for wealth inequality among individuals.
Over the past decades, countries have become richer but governments have become poor.
- The ratio of net private wealth to net national income gives insight into the total value of wealth commanded by individuals in a country, as compared to the public wealth held by governments. The sum of private and public wealth is equal to national wealth. The balance between private and public wealth is a crucial determinant of the level of inequality.
- There has been a general rise in net private wealth in recent decades, from 200–350% of national income in most rich countries in 1970 to 400–700% today. This was largely unaffected by the 2008 financial crisis, or by the asset price bubbles seen in some countries such as Japan and Spain (Figure E6). In China and Russia there have been unusually large increases in private wealth; following their transitions from communist- to capitalist-oriented economies, they saw it quadruple and triple, respectively. Private wealth–income ratios in these countries are approaching levels observed in France, the UK, and the United States.

- Conversely, net public wealth (that is, public assets minus public debts) has declined in nearly all countries since the 1980s. In China and Russia, public wealth declined from 60–70% of national wealth to 20–30%. Net public wealth has even become negative in recent years in the United States and the UK, and is only slightly positive in Japan, Germany, and France (Figure E7). This arguably limits government ability to regulate the economy, redistribute income, and mitigate rising inequality. The only exceptions to the general decline in public property are oil-rich countries with large sovereign wealth funds, such as Norway.

IV. What are our new findings on global wealth inequality?
The combination of large privatizations and increasing income inequality within countries has fueled the rise of wealth inequality among individuals. In Russia and the United States, the rise in wealth inequality has been extreme, whereas in Europe it has been more moderate. Wealth inequality has not yet returned to its extremely high early-twentieth-century level in rich countries.
Wealth inequality among individuals has increased at different speeds across countries since 1980.
- Increasing income inequality and the large transfers of public to private wealth occurring over the past forty years have yielded rising wealth inequality among individuals. Wealth inequality has not, however, yet reached its early-twentieth-century levels in Europe or in the United States.
- The rise in wealth inequality has nonetheless been very large in the United States, where the top 1% wealth share rose from 22% in 1980 to 39% in 2014. Most of that increase in inequality was due to the rise of the top 0.1% wealth owners. The increase in top-wealth shares in France and the UK was more moderate over the past forty years, in part due to the dampening effect of the rising housing wealth of the middle class, and a lower level of income inequality than the United States’ (Figure E8).

- Large rises in top-wealth shares have also been experienced in China and Russia following their transitions from communism to more capitalist economies. The top 1% wealth share doubled in both China and Russia between 1995 and 2015, from 15% to 30% and from 22% to 43%, respectively.
V. What is the future of global inequality and how should it be tackled?
We project income and wealth inequality up to 2050 under different scenarios. In a future in which “business as usual” continues, global inequality will further increase. Alternatively, if in the coming decades all countries follow the moderate inequality trajectory of Europe over the past decades, global income inequality can be reduced—in which case there can also be substantial progress in eradicating global poverty.
The global wealth middle class will be squeezed under “business as usual.”
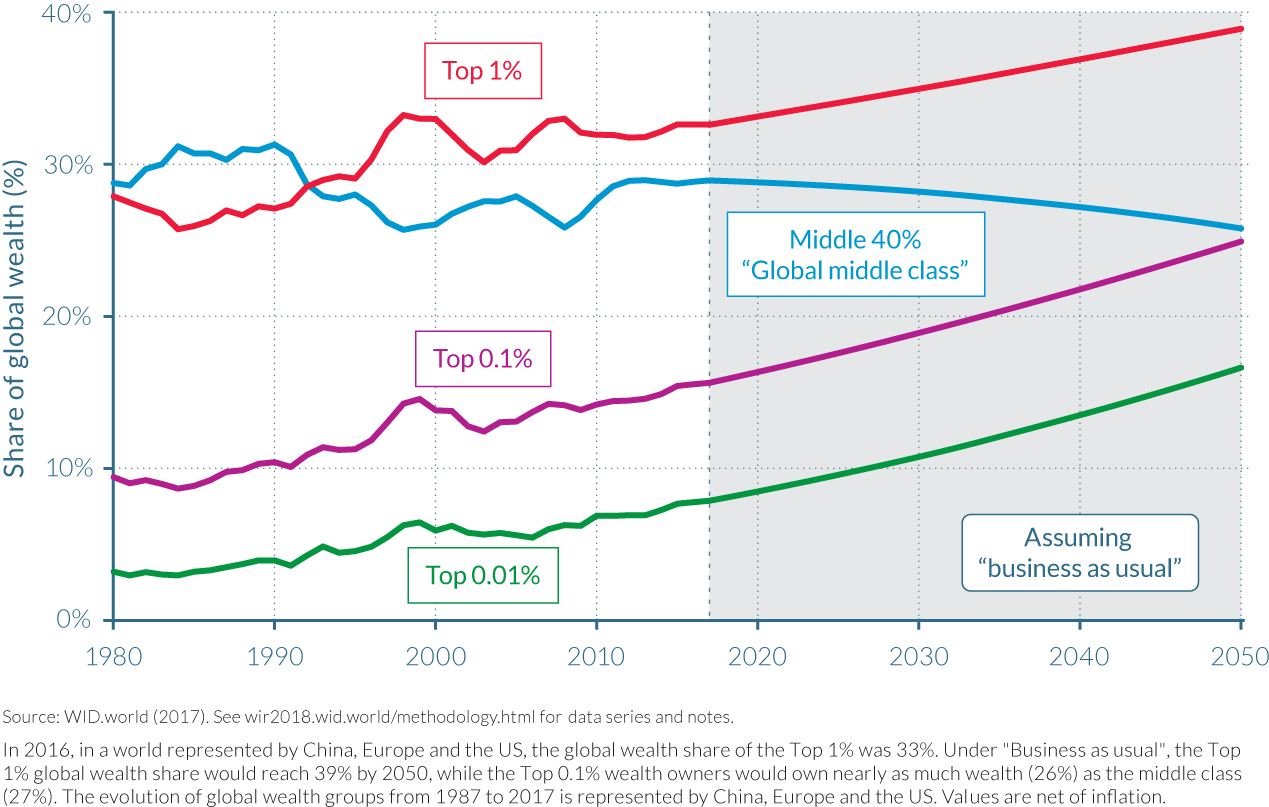
- Rising wealth inequality within countries has helped to spur increases in global wealth inequality. If we assume the world trend to be captured by the combined experience of China, Europe and the United States, the wealth share of the world’s top 1% wealthiest people increased from 28% to 33%, while the share commanded by the bottom 75% oscillated around 10% between 1980 and 2016.
- The continuation of past wealth-inequality trends will see the wealth share of the top 0.1% global wealth owners (in a world represented by China, the EU, and the United States) catch up with the share of the global wealth middle class by 2050 (Figure E9).
Global income inequality will also increase under a “business as usual” scenario, even with optimistic growth assumptions in emerging countries. This is not inevitable, however.
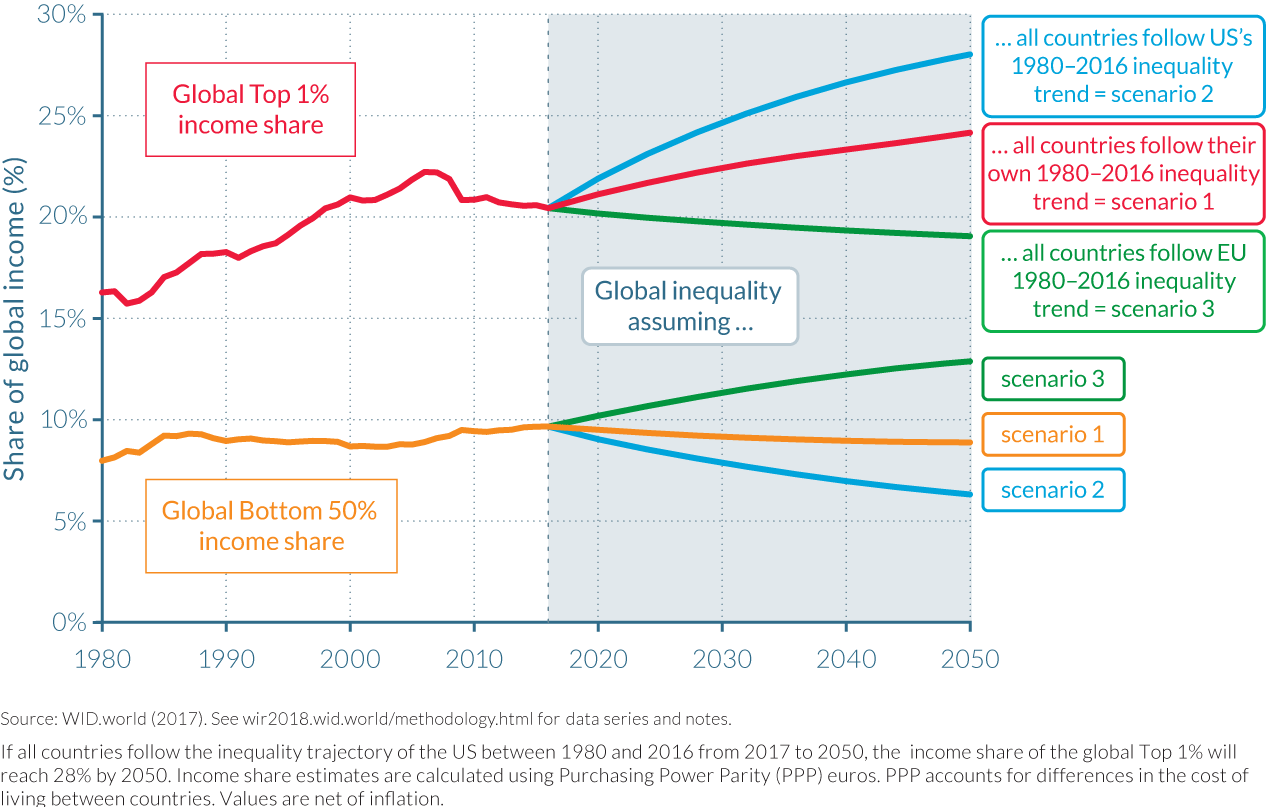
- Global income inequality will also increase if countries prolong the income inequality path they have been on since 1980—even with relatively high income growth predictions in Africa, Latin America, and Asia in the coming three decades. Global income inequality will increase even more if all countries follow the high-inequality trajectory followed by the United States between 1980 and 2016. However, global inequality will decrease moderately if all countries follow the inequality trajectory followed by the EU between 1980 and today (Figure E10).
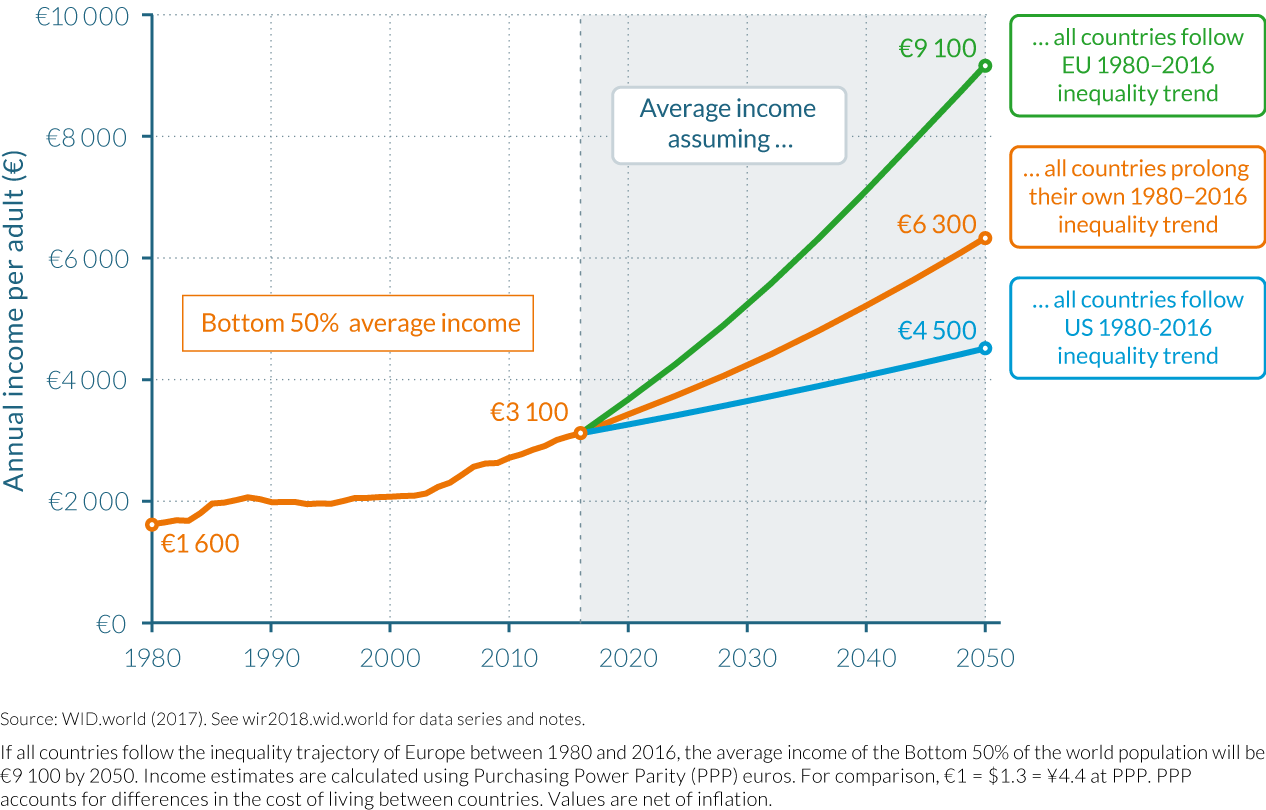
- Within-country inequality dynamics have a tremendous impact on the eradication of global poverty. Depending on which inequality trajectory is followed by countries, the incomes of the bottom half of the world population may vary by factor of two by 2050 (Figure E11), ranging from €4 500 to € 9100 per year, per adult.
Tackling global income and wealth inequality requires important shifts in national and global tax policies. Educational policies, corporate governance,
and wage-setting policies need to be reassessed in many countries. Data transparency is also key.
Tax progressivity is a proven tool to combat rising income and wealth inequality at the top.
- Research has demonstrated that tax progressivity is an effective tool to combat inequality. Progressive tax rates do not only reduce post-tax inequality, they also diminish pre-tax inequality by giving top earners less incentive to capture higher shares of growth via aggressive bargaining for pay rises and wealth accumulation. Tax progressivity was sharply reduced in rich and some emerging countries from the 1970s to the mid-2000s. Since the global financial crisis of 2008, the downward trend has leveled off and even reversed in certain countries, but future evolutions remain uncertain and will depend on democratic deliberations. It is also worth noting that inheritance taxes are nonexistent or near zero in high-inequality emerging countries, leaving space for important tax reforms in these countries.
A global financial register recording the ownership of financial assets would deal severe blows to tax evasion, money laundering, and rising inequality.
- Although the tax system is a crucial tool for tackling inequality, it also faces potential obstacles. Tax evasion ranks high among these, as recently illustrated by the Paradise Papers revelations. The wealth held in tax havens has increased considerably since the 1970s and currently represents more than 10% of global GDP. The rise of tax havens makes it difficult to properly measure and tax wealth and capital income in a globalized world. While land and real-estate registries have existed for centuries, they miss a large fraction of the wealth held by households today, as wealth increasingly takes the form of financial securities. Several technical options exist for creating a global financial register, which could be used by national tax authorities to effectively combat fraud.
More equal access to education and well-paying jobs is key to addressing the stagnating or sluggish income growth rates of the poorest half of the population.
- Recent research shows that there can be an enormous gap between the public discourse about equal opportunity and the reality of unequal access to education. In the United States, for instance, out of a hundred children whose parents are among the bottom 10% of income earners, only twenty to thirty go to college. However, that figure reaches ninety when parents are within the top 10% earners. On the positive side, research shows that elite colleges who improve openness to students from poor backgrounds need not compromise their outcomes to do so. In both rich and emerging countries, it might be necessary to set transparent and verifiable objectives—while also changing financing and admission systems—to enable equal access to education.
- Democratic access to education can achieve much, but without mechanisms to ensure that people at the bottom of the distribution have access to well-paying jobs, education will not prove sufficient to tackle inequality. Better representation of workers in corporate governance bodies, and healthy minimum-wage rates, are important tools to achieve this.
Governments need to invest in the future to address current income and wealth inequality levels, and to prevent further increases in them.
- Public investments are needed in education, health, and environmental protection both to tackle existing inequality and to prevent further increases. This is particularly difficult, however, given that governments in rich countries have become poor and largely indebted. Reducing public debt is by no means an easy task, but several options to accomplish it exist—including wealth taxation, debt relief, and inflation— and have been used throughout history when governments were highly indebted, to empower younger generations.