Part I - The WID.world project and the measurement of economic inequality
1 The WID.world project and the measurement of economic inequality
This report is based on economic data available on WID.world, the most extensive database on the historical evolution of the world distribution of income and wealth, both within and between countries.
- WID.world is a cumulative and collaborative research process that originated in the early 2000s, and now includes over one hundred researchers covering more than seventy countries on all continents.
- Official inequality measures mostly rely on self-reported survey data, which frequently underestimate top income levels and usually are inconsistent with macroeconomic growth figures.
- Consequently, people often have a difficult time relating the GDP growth figures they hear about in the media to the individual income and wealth trajectories they see around them. This can lead to a lack of trust in economic statistics and get in the way of healthy public debates on inequality.
- WID.world attempts to correct for this problem by combining available sources (national accounts, fiscal and wealth data, surveys), spanning time periods as long as two hundred years for some countries, in a consistent and systematic manner.
- Our goal is to present inequality statistics that are consistent with macroeconomic statistics such as GDP and that can be easily understood and used by the public, to help ground the democratic debate in facts.
- We use modern digital tools to make these data available freely online on WID.world. Our data series are fully transparent and reproducible; our computer codes, assumptions, and detailed research papers are available online so that all interested persons can access and use them.
How to measure income and wealth inequality?
Economic inequality is a complex phenomenon that can be measured in various ways using different indicators and data sources. Choices among these indicators are not neutral and may have substantial impacts on findings. This is not only a matter of academic debate among statisticians. Anyone hoping to design appropriate policies should have a clear understanding of current and past inequality dynamics. We thus briefly discuss below key concepts which are central to understanding the rest of this report.
Whatever the source of data and the metric used to monitor economic inequality, its measurement starts from the same basic input: a distribution. For any income or wealth group, a distribution shows the number of individuals in this group and their shares of the group’s total income or wealth. As such, a distribution is a relatively complex set of information, which is not straightforward to summarize. Inequality indices attempt to describe such complex data sets in a synthetic way.
Official inequality reports and statisticians often use synthetic measures of inequality such as the Gini index. Technically speaking, the Gini corresponds to the average distance between the income or wealth of all the pairs of individuals. To make it comparable between countries and over time, it is appropriately normalized so that complete equality corresponds to 0, and complete inequality (one person owning everything) corresponds to 1. The Gini index is often presented as a convenient, synthetic tool that allows comparisons of inequality across time and space.
However, this kind of index is technical both in its calculation and in the mathematical knowledge required of the reader to interpret it. According to the World Bank, for example, the Gini index for consumption inequality in Vietnam in 2014 was equal to 0.38. Is this large or small? A Gini of 0.38 implies that the distance separating Vietnam from perfect inequality (which is 1 on the index) is 0.62. Is this an acceptable distance from perfect inequality? It is not easy for citizens, journalists, and policymakers to make sense of such a metric.
Additionally, the strength of the Gini index—that it combines information on all individuals in a society—is also its main weakness. Because it summarizes a distribution in a single index, a given value for the Gini coefficient can result from distributions that are actually radically different. For example, a country may experience both a Gini-reducing decrease in poverty and a rise in the share of income going to the top 10%, which increases the Gini. If these effects offset each other, the overall Gini can remain constant, creating the impression that the distribution of income is not changing—while in fact the middle class is being squeezed out.
Because of its underlying mathematical properties, the Gini index also tends to downplay shifts happening at the top end and at the bottom of the distribution, precisely where the most evolution has taken place over the last decades. Finally, the raw data used to compute Gini indexes is often of relatively low quality, especially at the top of the distribution: top income and wealth levels are often implausibly low. The use of synthetic indexes can sometimes be a way to sweep such data issues under the rug.
Rather than use a single index, we believe it is preferable to use several metrics of inequality and to be transparent about which specific groups of the population are driving the evolution of inequality. This is the choice we make throughout this report. Distributions can be broken down into concrete social groups representing fixed fractions of the population—for example, the bottom 10% of the population, the next 10%, and so on, all the way up to the top 10% and the top 1%. For each group, it is then possible to measure the average income in that group, and the minimum income required to be part of it. For instance, in the United States in 2016, an adult needs to earn more than $124 000 per year (€95 000) to break into the top 10% group. On average, the top 10% earners make $317 000 per year (€242 000). By stark contrast, the bottom 50% earners make $16 000 per year (€13 000) on average. Arguably, anyone in the United States can relate to such measures and compare these values to their own income.
Another powerful way to measure inequality is to focus on the share of national income captured by each group. In the United States, for example, the top 10% captures 47% of national income in 2016. That is, the average income in the top 10% is 4.7 times larger than the average income in the economy as a whole; this group earns 4.7 times more than it would in a perfectly equal society. The bottom 90%, by contrast, captures 53% of national income, so individuals in the bottom 90% on average earn 59% of the average income per adult (that is, 0.53 divided by 0.90). There is no moral judgment associated with this statement: the shares of the various groups may or may not be justified. What matters here is that this metric is both accurate and meaningful.
The analysis should not stop with the top 10%, but also describe the shares and income levels of other income groups, such as the bottom 50% or the 40% who fall between the bottom 50% and the top 10% and who are often referred to as the “middle class.” One may also want to refine the focus on the top of the distribution, looking at the top 1%, for instance, as recent research has shown that inequality within the top 10% is large and growing. It may then also be relevant to further decompose the top 1% into even smaller groups such as tenths of percentiles. This process can be continued, dividing the top 0.1% into tenths of tenth percentiles, and the top 0.01% into a tenths of tenths of tenth percentiles. Overall, this approach allows for a more detailed but still straightforward description of the level and evolution of inequality relative to what can be achieved by using synthetic indexes.
Where to look for global inequality data
Understandable inequality indices are necessary but not sufficient to enable sound debates on inequality. Ultimately what matter are reliable and trusted economic data sources. Producing reliable inequality statistics takes time, however, and providing such estimates for several countries and over long periods is not possible without the participation of many researchers—researchers with country-specific knowledge, access to data sources, and adequate understanding of the political, economic, and cultural specificities of each country. This may help explain why, thus far, the production of inequality statistics has been decentralized across different research groups, often using different concepts and estimation techniques.
Several world inequality databases exist today. These inequality databases include for instance the World Bank’s PovcalNet, the Luxembourg Income Study (LIS), the Socio-Economic Database for Latin America and the Caribbean (SEDLAC) and the OECD Income Distribution Database (IDD). There are also various sources that combine the aforementioned databases to increase their coverage, the most important being the World Panel Income Distribution (LM-WPID) and the Standardized World Income Inequality Database (SWIID). Lastly, the United Nations compiles the World Income Inequality Database (WIID), which consists of a nearly exhaustive census of all primary databases and individual research initiatives, with detailed information about the concepts used.
These databases have proved useful to researchers, policymakers, journalists, and the general public focusing on the evolution of inequality over the past decades. However, these sources also rely almost exclusively on a specific information source—namely, household surveys—which have important limitations when it comes to measuring inequality. Household surveys consist mostly of face-to-face or virtual interviews with individuals who are asked questions about their incomes, wealth, and other socio-economic aspects of their lives. Surveys are particularly valuable because they gather information about not only income or assets, but also social and demographic dimensions. They thus allow for a better understanding of the determinants of income and wealth inequality, and help place income and wealth inequality in broader contexts—such as racial, spatial, educational, or gender inequality.
The main problem with household surveys, however, is that they usually rely entirely on self-reported information about income and wealth. As a consequence, they misrepresent top income and wealth levels, and therefore overall inequality. This can also contribute to major inconsistencies between macroeconomic growth (as recorded by GDP statistics) and household income growth (as recorded by surveys for the bottom and middle parts of the distribution), thereby leading to a lack of trust in economic statistics. (Box 1.1)
This report attempts to present an integrated and consistent approach to gauging both income and wealth inequality. As its title indicates, the key ambition and novelty of the World Wealth and Income Database (WID.world), upon which this report is built, is indeed to put equal emphasis on wealth and income, and to relate the two aspects of economic inequality as closely as possible.
There are several reasons for this. First, in order to properly analyze income inequality, it is critical to decompose total income into two categories of income flows: income from labor and income from capital. The latter category has played an important role in the rise of inequality in recent decades—and an even bigger role if we look at the evolution of the distribution of income in the very long run.
Next, one of our key goals is to relate macroeconomic issues—such as capital accumulation, the aggregate structure of property, privatization or nationalization policies, and the evolution of public debt—to the microeconomic study of inequality. Far too often, the study of the “capital” side of the economy (that is, focused on capital, investment, debt, and so forth) is separated from the study of the “household” side (that is, looking at wages, transfers, poverty, inequality, and other issues).
We should make clear, however, that a lot of progress needs to be made before we can present a fully integrated approach. The present report should be viewed as one step in this direction. For example, in Part IV of the report, we are able to fully analyze the joint evolution of inequality of income and wealth for a number of countries (in particular, the United States and France). Doing so requires careful measurement not only of the inequality of pre-tax and post-tax income, but also of the distribution of saving rates across the different deciles of the distribution of pre-tax income.
This kind of analysis will gradually be extended to more and more countries, as more data become available. The combination of series on the distribution of pre-tax and post-tax income, savings, and wealth will also allow us to relate in a systematic manner the inequality of income, wealth, and consumption (that is, income minus savings).
In our view, however, it would be a mistake to overemphasize the consumption perspective, as the literature on inequality and poverty has sometimes done. Consumption is obviously a very important indicator of wealth, particularly at the bottom of the distribution. The problem is that the household surveys routinely used to study consumption inequality tend to underestimate the consumption, income, and wealth levels reached by the top of the distribution. Also, the notion of consumption is not always well defined for top income groups, which typically save very large proportions of their income. They choose to do so partly in order to consume more in later years, but more generally in order to consume the prestige, security, and economic power conferred by wealth ownership. In order to develop a consistent and global perspective on economic inequality—that is, a perspective that views economic actors not only as consumers and workers but also as owners and investors—it is critical, in our view, to put equal emphasis on income and wealth.
Our various concepts of income and wealth—in particular, pre-tax national income, post-tax national income, and personal wealth—are defined using international guidelines in national income and wealth accounts (SNA 2008). The exact technical definitions are available online in the DINA Guidelines (Distributional National Accounts).
Fiscal data capture inequality dynamics that survey data cannot
Survey estimates of inequality rely on self-reported information collected from nationally representative groups of the population. The first problem with any such survey is its limited sample size. Given the small number of extremely rich individuals, the likelihood that they will be included in surveys is typically very small. Some surveys attempt to address this issue by oversampling the rich —select more rich individuals to be surveyed—, but this is typically insufficient to obtain reliable information on the wealthy, because non-response rates are high among the rich. Furthermore, because very large self-reported incomes in surveys are sometimes due to reporting errors, surveys often use top codes (or corrections) to clean up extreme values. Therefore, surveys generally severely underestimate the income and wealth levels at the very top of the distribution, precisely where some of the largest changes have occurred over the past decades.
The best way to overcome this limitation is to combine different types of data sources, and in particular to use administrative tax data together with survey data. Initially compiled for tax collection purposes, tax data are also valuable for researchers. As compared to surveys, they give a more complete and reliable picture of the distribution of income and wealth among the wealthy.
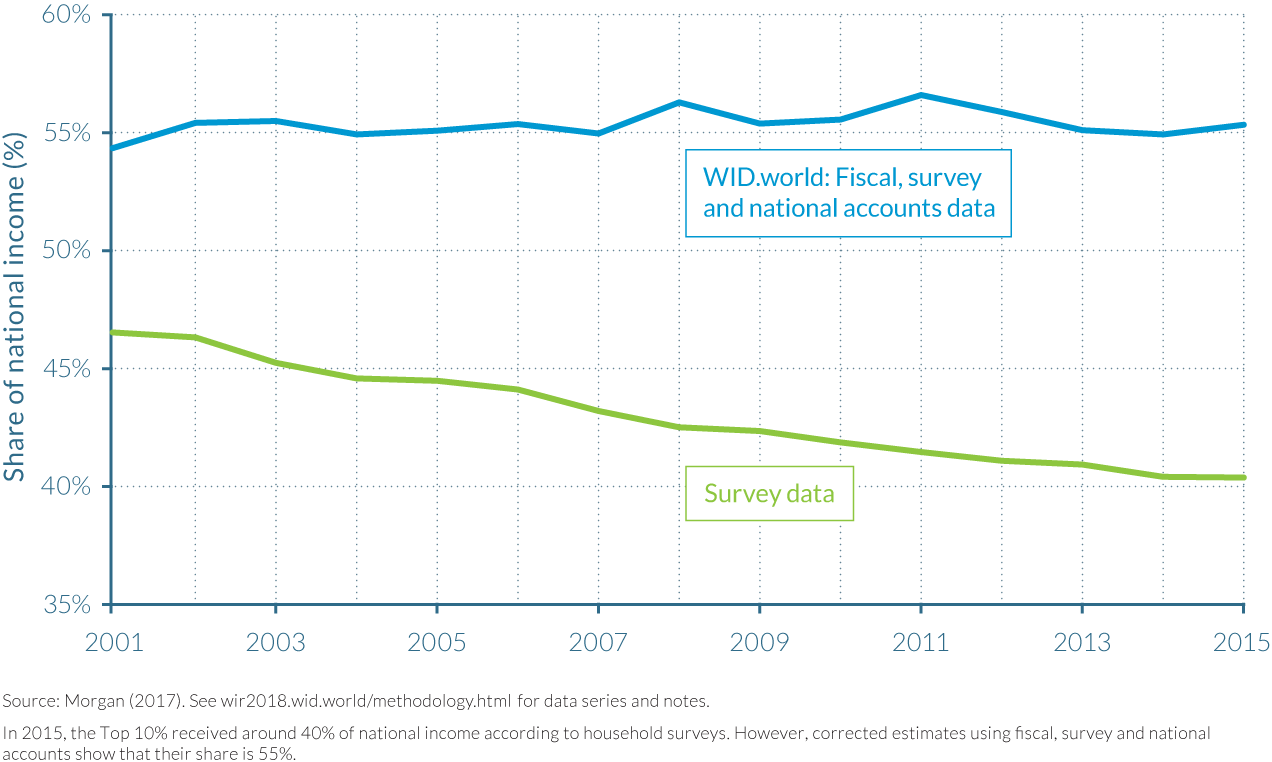
To illustrate the differences in inequality estimates between survey and fiscal data, consider the following examples. According to official survey data, the top 1% of Chinese earners captured 6.5% of national income in 2015. However, new estimates produced as part of the WID.world project show that correcting surveys with newly released tax data on high-income earners is enough to increase the income share of the top 1% from 6.5% to close to 11.5% of national income.1 In Brazil, survey data indicate that the income received by the richest 10% is just over 40% of total income in 2015, but when surveys are combined with fiscal data and national accounts, we find that this group receives, in fact, more than 55% of national income (see Figure 1.1). As can be seen from these two examples, the extent to which surveys underestimate top shares can vary from one country to another—and also from one percentile to another—but it is always likely to be substantial. Comparisons between countries are likely to be unreliable if made based on survey data without adjusting for the top by including fiscal and national accounts data.
Poor coverage of the wealthy in household surveys can also impede accurate comparisons across time. For example, according to Brazilian survey data, inequality in the country decreased between 2001 and 2015—but income tax data show that, in fact, inequality remained stubbornly high over this period. Similar results can be found in China, where the income share of the top 10% increased by fifteen percentage points from 1978 to 2015, while, according to official survey estimates, the increase was only by nine percentage points.1 In India, the absence of top earners in survey data could explain up to 30% of the gap between the very low macroeconomic growth of consumption seen in survey data, and the much faster growth rate seen in national account data.2
Administrative tax data are not free from measurement issues at the top. They also tend to underestimate top income and wealth levels, due to tax evasion. For this reason, our inequality estimates should be viewed in most cases as lower-bound estimates—but at least these are more plausible lower bounds than survey-based measures. In all countries, including in countries with potentially widespread evasion, we find that top income levels reported in tax data are substantially larger than in surveys. The reason for this is simple: noncompliant taxpayers face at least some potential sanctions if they underreport their incomes to tax authorities, whereas no such sanctions exist for underreporting income in a survey. Furthermore, tax authorities increasingly collect data from third parties (such as employers and banks), which increases tax compliance.
Another advantage of tax data over surveys is coverage of longer time periods. Administrative tax data are usually available on a yearly basis starting with the beginning of the twentieth century for the income tax, and as far back as the early nineteenth century for the inheritance tax in some countries. In contrast, nationally representative surveys are rarely carried out annually, and were not generally carried out at all before the 1970s–1980s. Using them, it would be impossible to study long-run evolutions—a serious limitation given that some of the most important transformations in inequality span long periods of time. Having data covering many decades helps disentangles long-term trends reflecting major macroeconomic transformations from short-term variations due to episodic shocks or measurement issues.
The renewed focus on income inequality and the World Top Incomes Database
During the past fifteen years, there has been renewed interest in understanding the long-run evolution of income inequality. Many studies have constructed top income share series for a large number of countries.3 These studies have generated large volumes of data, intended as a research resource for further analysis as well as a source to inform the public debate on inequality trends. To a large extent, this literature followed the pioneering work of Simon Kuznets, extending his income share measurement to more countries and years.4
In January 2011, The World Top Incomes Database (WTID) was created to provide convenient and free access to these series. Thanks to the contribution of over a hundred researchers, the WTID expanded to include series on income inequality for more than thirty countries, spanning most of the twentieth and early twenty-first centuries. These series had a large impact on the global inequality debate because they made it possible to compare the income shares of top groups (for example, the top 1%) over long periods of time, revealing new facts and refocusing the discussion on the rise in inequality seen in recent decades.
Although the top income share series available in the WTID all had a common methodological underpinning and goal—using tax data to document the long-run evolution of income concentration—the units of observation, the income concepts, and the statistical methods used were never made fully homogeneous over time and across countries. Attention was restricted for the most part, moreover, to the top decile rather than to the entire distribution, and these series were mostly about income, not wealth. All this pointed to the need for a methodological reexamination and clarification.
In December 2015, the WTID was subsumed into the WID, the World Wealth and Income Database (WID.world). The change in name reflects the extended scope and ambition of the project. The new database aims at measuring not only income but also wealth inequality, and it aims at capturing the dynamics of income and wealth across the entire distribution and not only at the top.
WID.world’s key novelty: distributing national accounts in a consistent way
The key novelty of the WID.world project is to produce Distributional National Accounts (DINA) relying on a consistent and systematic combination of fiscal, survey, wealth and national accounts data sources.5 The complete DINA methodological guidelines (Alvaredo et al., 2016), as well as all computer codes and detailed data series and research papers, are available online on WID.world. Here we summarize only some of the main methodological points.
As explained above, administrative data on income and wealth tend to be more reliable sources of information than surveys. Unfortunately, they provide information on only a subset of the population—namely, the part filing tax returns. This issue is particularly important in emerging countries. In India, for example, income tax payers represent only slightly more than 6% of the adult population; thus, survey data are the only available sources of information to measure inequality in the bottom 94% of the distribution. We must critically and cautiously rely on survey data sources in combination with fiscal and wealth sources and national accounts to estimate the distribution of national income or wealth.
Another limitation of tax data is that they are subject to changes in fiscal concepts over time and across countries. Typically, depending on whether income components (such as labor income, dividends, and capital income) are subject to tax, they may or may not appear in the tax data from which distributional statistics can be computed. These differences can make international and historical comparisons difficult.
To some extent, these harmonization issues can be overcome by using national account data—and in particular, the concepts of national income and national wealth—as a benchmark. Our choice of these concepts for the analysis of inequality does not mean that we consider them perfectly satisfactory. Quite the contrary, our view is that national accounts statistics are insufficient and need to be greatly improved.
In our view, however, the best way to improve on the national accounts is to confront them with other sources and to attempt to distribute national income and wealth across percentiles. The key advantage of national accounts is that they follow internationally standardized definitions for measuring the economic activity of nations. As such, they allow for a more consistent comparison over time and across countries than fiscal data. National accounts definitions, in particular, do not depend upon local variations in tax legislation or other parts of the legal system.
One of the most widely used aggregate of the national accounts is gross domestic product (GDP). But GDP statistics do not provide any information about the extent to which the different social groups benefit (or not) from growth.6 In addition, GDP is not a satisfactory measure of the total income of a country, because a country with extensive capital depreciation or large income flowing abroad can have a large GDP but much less income to distribute to its residents.
The concept of national income (NI) is a better benchmark indicator to compare countries and to analyze the distribution of income and growth. National income is equal to GDP minus capital depreciation plus net foreign income. It reflects a nation’s income more closely than GDP does. The WID.world database combines macroeconomic data from different sources in order to produce national income series for about two hundred countries. These national income estimates are consistent with those of international organizations, with one important improvement: our series address the issue that some income is missing from published national accounts. In the official data, foreign income paid is higher than foreign income received at the global level—because some of the income received in tax havens is nowhere recorded. We allocate this global missing income drawing on methods first developed by Zucman (2013).7
Total fiscal income (as measured by tax data) is always less than national income (as measured in the national accounts). Part of the difference is due to tax-exempt income flows such as imputed rent (the rental value of owner-occupied housing) and undistributed profits (the profits of corporations not distributed to individuals but ultimately benefitting owners of corporations). When data are available and sufficiently precise, we attribute the fraction of national income missing from fiscal data to the income groups who benefit from these sources of income. This operation can have significant implications for the distribution of income. For example, once we add undistributed profits to fiscal income, the share of income earned by the top 1% in China increases from 11.5% to 14% in 2015. A number of recent research papers have attempted to construct inequality statistics accounting for tax-exempt income, both in developed and emerging countries, including the United States, China, France, Brazil, and Russia.
Data limitations currently make such adjustments impossible, however, in a number of countries, which implies that inequality estimates for these countries tend to be downwardly biased. In such cases, we simply use our national income series to scale up fiscal incomes proportionally so that they add up to national income.8 This transformation does not affect the distribution of income, but allows us to compare the evolution of income levels over time and across countries more meaningfully. For example, our data show that the average pre-tax national income per adult within the top 1% is similar in India and China in 2013 (€131 000 versus €157 000, respectively) but much higher in Brazil (€436 000) and in the United States (€990 000).
Taking wealth inequality into account
One reason for the growing interest in wealth inequality is the recognition that the increase in income inequality in recent years is partly a result of rising capital incomes (in addition to changes in wages and earned income). These capital incomes include interest, dividends, retained earnings of corporations, and rents. While most of the population earns little capital income, this form of income accounts for a significant proportion of income at the top of the income distribution.
Another reason for the renewed interest in wealth is that aggregate wealth itself is rising faster than income—so the ratio of national wealth to national income is rising fast in many countries (as was first shown by Piketty and Zucman, 2014). One consequence is that inherited wealth—which declined for much of the twentieth century—is taking on renewed significance in a number of countries. There is also extensive evidence (in billionaire rankings, for example) that top global wealth-holders have accumulated wealth at a much faster rate than the average person and have therefore benefited from a substantial increase in their share of global wealth.
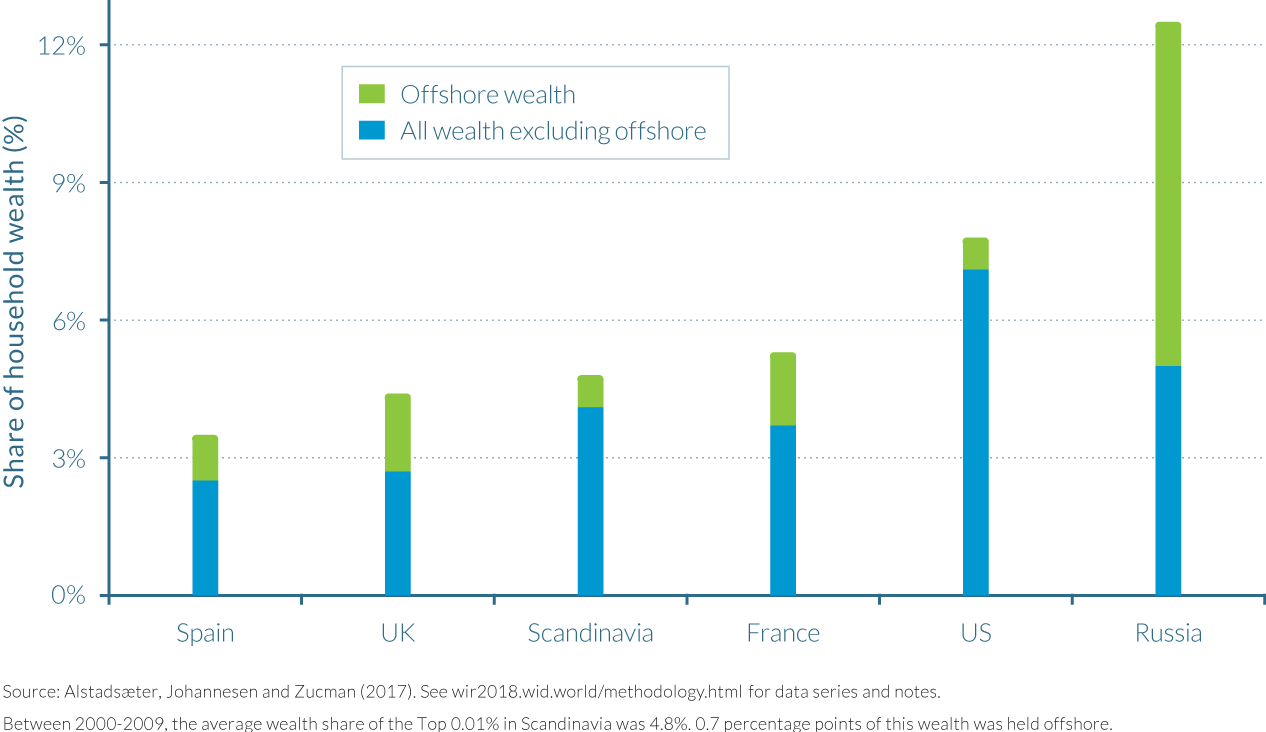
Because most countries do not tax wealth directly, producing reliable estimates of wealth inequality requires combining different data sources, such as billionaire rankings and also income tax data and inheritance tax data—as in the pioneering work of A. B. Atkinson and A. Harrison (1978).9 The globalization of wealth management since the 1980s raises additional new challenges, as a growing amount of world wealth is held in offshore financial centers. Work led by Gabriel Zucman shows that accounting for these offshore assets has large implications for the measurement of wealth at the very top end of the distribution (see Figure 1.2).10 More generally, it is becoming critical to measure the inequality of income and wealth from a global perspective, and not simply at the country level, as we discuss below.
From national to regional and global distributions of income and wealth
One central objective of the WID.world project is to produce global income and wealth distributions. This amounts to ranking individuals from the poorest to the richest at the global level, ignoring national boundaries. We also provide estimates of income and wealth inequality for broad regions, such as Europe and the Middle East.
One might wonder whether it makes sense to produce global inequality estimates, given that most policies (including policies to tackle inequality) are voted and implemented at the national level. In our view, it is complementary to study inequality dynamics at the national, regional, and global levels. First, although there exists no global government, there are attempts to foster global cooperation to tackle issues such tax havens and environmental inequalities. Next, growing economic interdependence implies that one needs to look at global inequality dynamics to fully understand the underlying economic forces shaping national inequality. Finally, political perceptions about inequality might be determined by one’s position not only within a given country but also by comparison to others at the regional and global level.
Since the 1980s the world has evolved towards more economic, financial, and cultural integration. Even if globalization may be called into question today—as recent elections in the UK and the United States have proved—the world remains an interconnected environment where capital, goods, services, and ideas are highly mobile and their circulation is facilitated by innovations in information technology. To some extent, there is already a global community, and in this global environment it is logical for citizens to compare themselves to one another.
Individuals in one country may feel deeply concerned, from an ethical perspective, by the situations of those at the bottom of the global distribution.11 They may also be concerned about their own positions in the global or regional distributions of income and wealth. The stagnating or sluggish income growth of lower- and middle-income groups in rich countries, considered in a context of high growth in emerging countries and at the top of the global income pyramid, may have contributed to anti-establishment votes over recent years. National citizens may already be thinking across borders.
Global inequality data are also necessary to analyze the distributional consequences of globalization. Is growth at the global top disproportionately high? Or is the share of total growth captured by the global top 1% small compared to the growth that has accrued to the bottom 50%? The first step toward answering these fundamental questions is to collect and produce global inequality statistics that cover all groups of the population, up to the very top.
As will be described in Chapter 2.1, we move toward this goal carefully, aggregating only regions and countries for which we have consistent data series. We present results for the global distribution of income, but data limitations do not allow us yet to analyze the global distribution of wealth. (Our “global” wealth estimates take into account only the United States, Europe, and China.) Producing truly global wealth distribution series will be a major goal of future editions of the World Inequality Report. Eventually, we also seek to deepen our understanding of the interplay between global economic inequality and other forms of global inequality, such as environmental injustice.12 Such inequality metrics can help environmental and economic policy making—for example, when it comes to allocating efforts to tackle climate change across individuals, countries, and regions.
WID.world and the World Inequality Report: open access, transparency, and replicability at its core
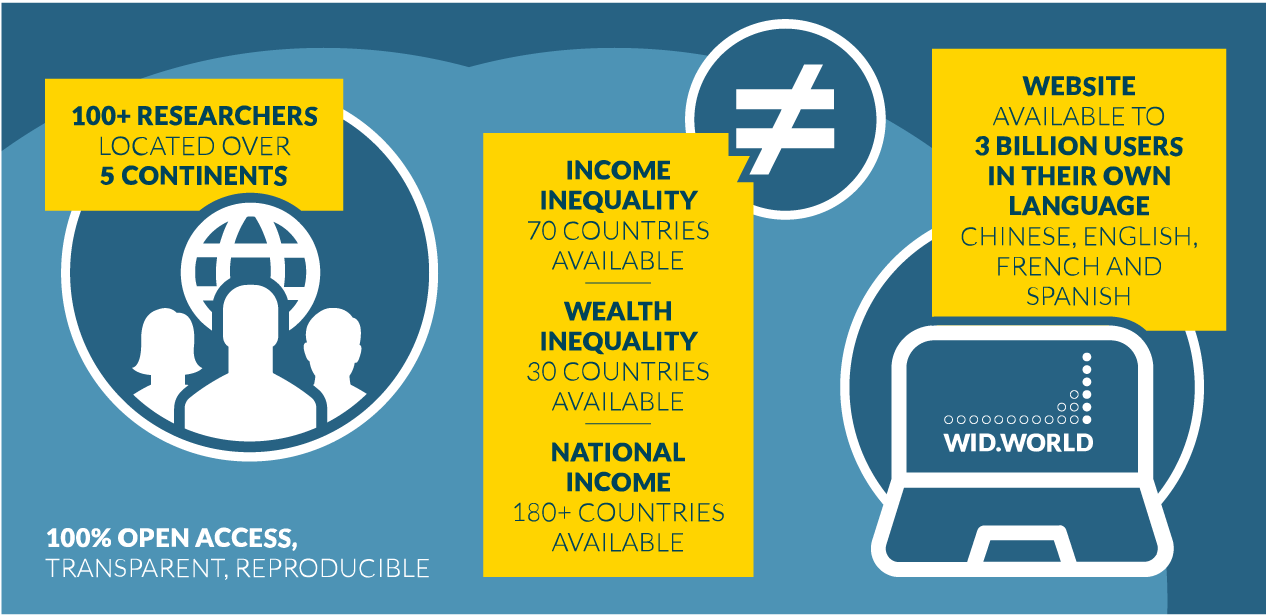
In January 2017, we released the first version of the WID.world website with the objective of reaching a wide audience of researchers and the general public with a user-friendly interface. Thanks to the work of over a hundred researchers located on five continents, the WID.world website now gathers income inequality data for more than 70 countries, wealth inequality and public and private wealth data for more than 30 countries, and national income and GDP data for more than 180 countries. Thus WID.world provides access to the most extensive available database on the historical evolution of income and wealth inequality, both between and within countries. As part of our attempts to democratize access to inequality data, we have also made WID.world available in four languages—Chinese (Mandarin), English, French, and Spanish—and thus to three billion people in their own language (see Figure 1.3).
Open access, transparency, and reproducibility are the core values of the WID.world project. The website was designed to allow anyone, expert or nonexpert, to access and make sense of historical global inequality data. All WID.world series, moreover, are accompanied with a methodological paper providing extensive descriptions of the method and concepts used.
Raw data and the computer codes used to generate inequality estimates are also updated on the website. This level of transparency is another key innovation in the landscape of economic data providers. It allows any interested researcher to refine our estimates, make different assumptions if they wish, and help develop new ideas for how inequality can be better measured and how this data can be used for the benefit of society. Our website comes along with a set of tools to analyze economic inequality.
The World Inequality Report 2018 is part of this initiative to democratize access to inequality statistics. All the series discussed and presented in the report are also available online and can be entirely reproduced. We should note, however, that this report contains analyses carried out specifically for the report, and hence, the report may not necessarily represent the views of all WID.world fellows. The World Inequality Report is a product of the World Inequality Lab, which relies on research completed as part of the WID.world project and novel research on global inequality dynamics.
NOTES
- T. Piketty, L. Yang, and G. Zucman, “Capital Accumulation, Private Property and Rising Inequality in China, 1978–2015,” NBER Working Paper no. 2338, National Bureau of Economic Research, June 2017, http://www.nber.org/papers/w23368.pdf.
- L. Chancel and T. Piketty, “Indian Income Inequality, 1922–2014: From British Raj to Billionaire Raj? WID.world Working Paper no. 2017/11, July 2017. http://wid.world/document/chancelpiketty2017widworld/.
- See, in particular, T. Piketty, Les hauts revenus en France au XXème siècle (Paris: Bernard Grasset, 2001); T. Piketty and E. Saez, “Income Inequality in the United States, 1913–1998,” Quarterly Journal of Economics 118, no.1 (2003): 1–39; A. B. Atkinson and T. Piketty, Top Incomes over the 20th Century: A Contrast between Continental European and English-Speaking Countries (Oxford: Oxford University Press, 2007); A. B. Atkinson and T. Piketty, eds., Top Incomes: A Global Perspective (Oxford: Oxford University Press, 2010); A. B. Atkinson, T. Piketty, and E. Saez, “Top Incomes in the Long Run of History,” Journal of Economic Literature 49, no. 1 (2011): 3–71.
- S. Kuznets, Shares of Upper Income Groups in Income and Savings (New York: National Bureau of Economic Research, 1953).
F. Alvaredo, A. B. Atkinson, L. Chancel, T. Piketty, E. Saez, and G. Zucman, “Distributional National Accounts (DINA) Guidelines: Concepts and Methods Used in the World Wealth and Income Database,” WID.world Working Paper no. 2016/2, December 2016, http://wid.world/document/dinaguidelines-v1/. - J. E. Stiglitz, A. Sen, and J. P. Fitoussi, “Report by the Commission on the Measurement of Economic Performance and Social Progress,” Paris, http://ec.europa.eu/eurostat/documents/118025/118123/Fitoussi+Commission+report.
- See T. Blanchet and L. Chancel, “National Accounts Series Methodology,” WID.world Working Paper no. 2016/1, September 2016, http://wid.world/document/1676/; and
- G. Zucman, “The Missing Wealth of Nations: Are Europe and the U.S. Net Debtors or Net Creditors?” Quarterly Journal of Economics 128, no. 3 (2013): 1321–1364.
- We multiplied each income group’s average fiscal income by National Income/Total Fiscal Income.
- A. B. Atkinson and A. J. Harrison, Distribution of Personal Wealth in Britain (Cambridge: Cambridge University Press, 1978).
- See Zucman, “The Missing Wealth of Nations”; G. Zucman, “Taxing across Borders: Tracking Personal Wealth and Corporate Profits,” Journal of Economic Perspectives 28, no. 4 (2014): 121–148; and A. Alstadsæter, N. Johannesen, and G. Zucman, “Who Owns the Wealth in Tax Havens? Macro Evidence and Implications for Global Inequality,” NBER Working Paper no. 23805, National Bureau of Economic Research, September 2017, http://www.nber.org/papers/w23805.pdf.
- S. Anand, and P. Segal, “The Global Distribution of Income,” Handbook of Income Distribution 2, part A (2015): 937–979.
- L. Chancel and T. Piketty, “Carbon and inequality: from Kyoto to Paris,” CEPR Policy Portal Vox, December 1, 2015, http://voxeu.org/article/carbon-and-inequality-kyoto-paris; L. Chancel and T. Piketty, “Trends in the Global Inequality of Carbon Emissions (1998–2013) and Prospects for an Equitable Adaptation Fund,” Paris School of Economics, November 3, 2015, http://piketty.pse.ens.fr/files/ChancelPiketty2015.pdf.